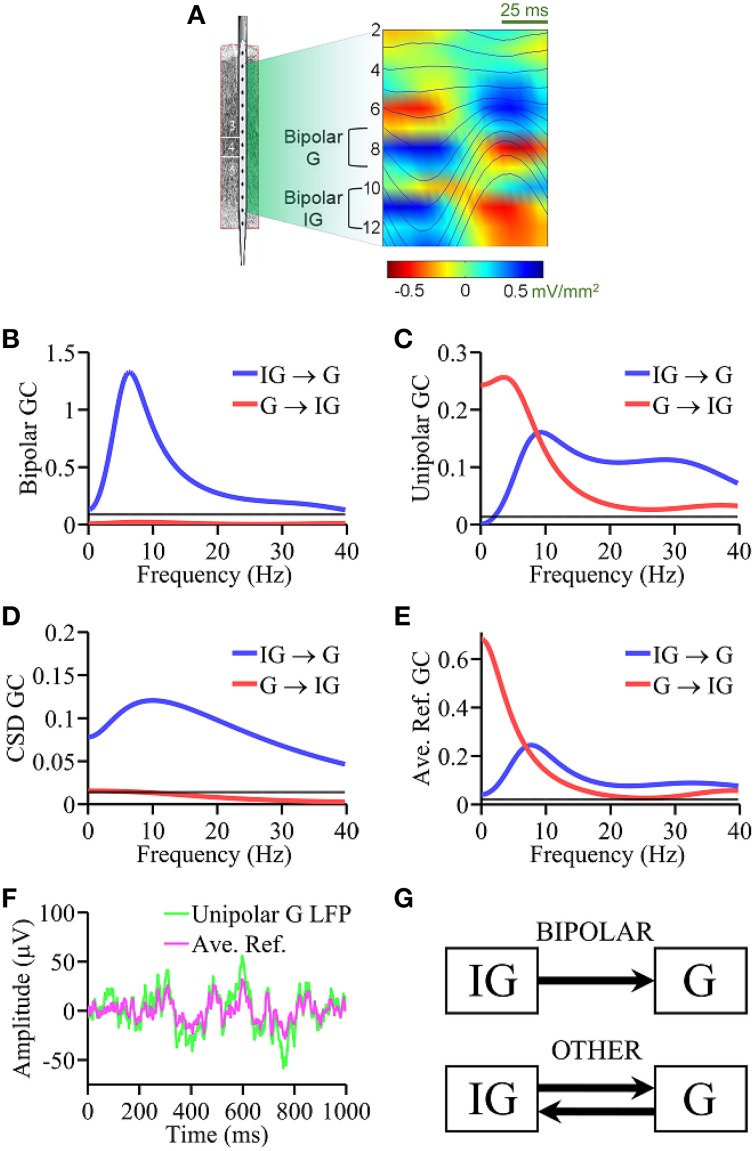
Figure 3.
Laminar recording from monkey V4. (A) Schematic of the multielectrode with 14 equally spaced (200 μm) contacts and alpha generators as identified by phase realigned and averaged (PRAT) CSD (color-coded) and LFPs (smooth traces, blue). Granger causality spectral analysis using (B) bipolar data, (C) unipolar data, (D) CSD data, and (E) average re-referenced data. (F) Comparison of unipolar LFPs from granular layer and average reference signals. (G) Schematic summarizing the Granger causality results where “OTHER” includes unipolar data, average re-referenced data and CSD data. Bipolar results are in agreement with ground truth. Black horizontal lines in (B–E) represents the level of statistical significance (p < 0.05).

