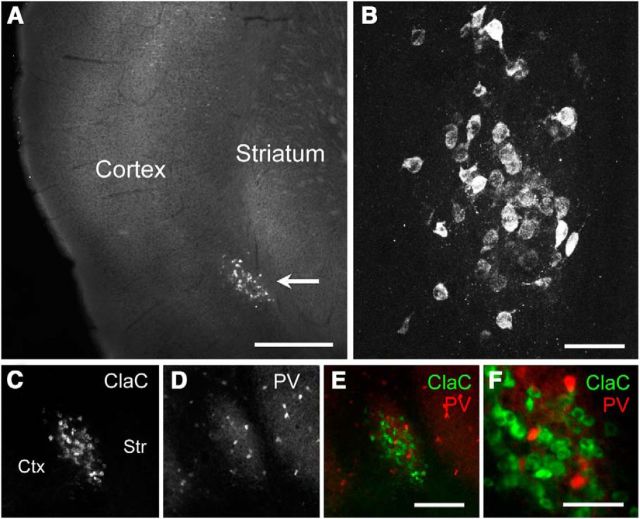
Figure 1.
Identification of the claustrum in mouse brain slices. A, Low-magnification image of retrogradely labeled ClaC neurons ipsilateral to the cortical injection site. B, Higher-magnification image of these neurons. C, Image of retrogradely labeled ClaC neurons. D, Image of immunohistochemistry for parvalbumin (PV), which is highly expressed in neuronal processes in the claustrum, in the same slice as in C. E, The two images in C and D are superimposed (green, ClaC; red, PV) and show clear coregistration. F, Higher-magnification image of PV and ClaC neurons. Ctx, Cortex; Str, striatum; Scale bars: A, 500 μm; B, F, 50 μm; E, 150 μm.

