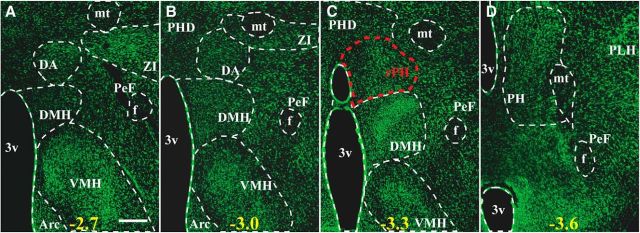
Figure 3.
Fluorescent Nissl-stained (green; NeuroTrace 500/525) rat brain sections at four posterior hypothalamic levels characterizing nuclear boundaries based on Paxinos and Watson's rat brain atlas. The region displaying high retrogradely labeled cell numbers from RPa and PaMP retrograde tracer injections is indicated in red and corresponds to a rostral region of the posterior hypothalamic nucleus (rPH; C). Numbers at the bottom of each micrograph indicate the approximate distance from bregma (mm) from anterior to posterior levels (A–D). 3v, Third ventricle; Arc, arcuate nucleus; DA, dorsal hypothalamic area; DMH, dorsomedial hypothalamic nucleus; f, fornix; mt, mammillothalamic tract; PeF, perifornical nucleus; PH, posterior hypothalamic nucleus; PHD, posterior hypothalamic area, dorsal part; PLH, peduncular part of the lateral hypothalamus; VMH, ventromedial hypothalamic nucleus; ZI, zona incerta. Scale bar: (in A) A–D, 300 μm.

