Figure 5.
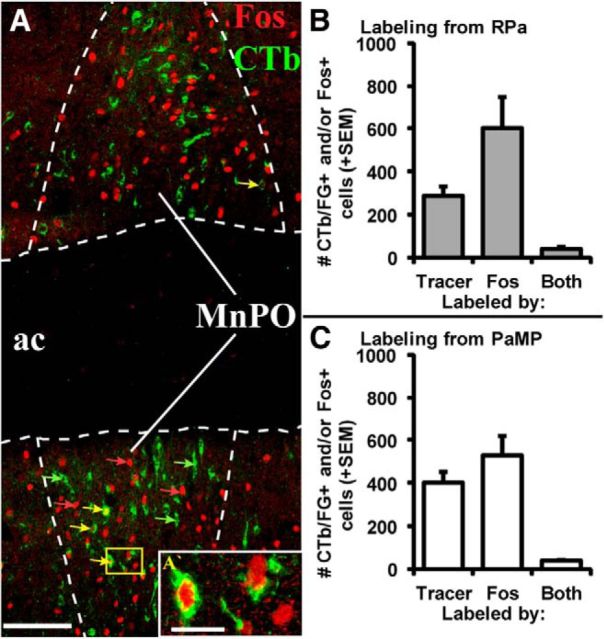
A, Representative double fluorescence immunohistochemical labeling of retrograde tracer (CTb deposited in PaMP, green; Case 53) and audiogenic stress-induced Fos immunoreactivity (red) in MnPO (0.1 mm posterior to bregma). Scale bar, 100 μm. Examples of single retrogradely labeled cells (green arrows), single Fos-labeled cells (red arrows), and cells expressing both markers (yellow arrows) are indicated, with the inset (A′; yellow box in A) providing magnified (40× objective) representation of single- and double-labeled processes. Scale bar, 20 μm. Mean + SEM cell counts of retrogradely labeled (Tracer), Fos-labeled (Fos), and double-labeled cells (Both) in MnPO following tracer injections in the RPa (B) or PaMP (C). Approximately 13% of all retrogradely labeled cells from either the RPa or PaMP were also immunoreactive for Fos. n = 4–7 cases per condition. ac, Anterior commissure.

