Figure 1.
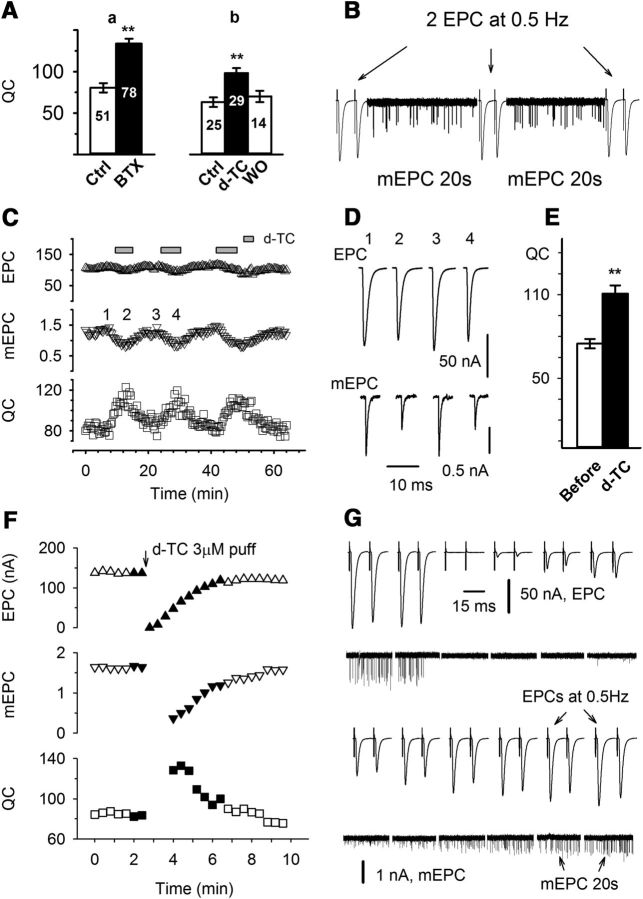
Upregulation of QC triggered by blocking AChRs is rapidly reversible. A, QC was increased by partially blocking AChRs with two antagonists: a, QC was sampled at a muscle holding potential of −70 mV from six TA muscles from ClC mice before and 1 h after the muscle was briefly exposed to α-BTX (1 mg/ml, 2 min) to irreversibly block AChRs. The QC was 80.5 ± 6.3 before and 133.8 ± 5.1 after partial block of AChRs (p < 0.01), a 66% increase; b, QC was sampled at −70 mV from three TA muscles from YFP mice before, after incubation with 0.1 μm d-TC for 1 h, and after washout. QC increased from 63.2 ± 5.8 to 98.4 ± 5.9 (p < 0.01), a 56% increase. Muscle contraction was prevented by the addition of 1 μm μ-conotoxin in the bathing solution. The numbers inside each bar indicate the number of fibers recorded. B, Recording protocol used in C (and other experiments wherever indicated). Two EPCs at 0.5 Hz and 20 s of mEPCs were alternately recorded, and the averaged values were used to calculate the corresponding QC and construct the plot shown in C. EPCs and mEPCs are scaled differently so that they both fit on the same trace. C, Average EPC (up triangle), mEPC (down triangle), and QC (square) were plotted over time during infusion and washout of D-TC from a TA muscle preparation voltage clamped at -45 mV. The bathing solution was switched to a solution containing 0.1 μm d-TC, where indicated. D, Averaged traces of EPCs and mEPCs taken from the record shown in C. The time they were recorded is indicated by corresponding numbers. E, Averaged QC taken before and 3 min after d-TC infusion. Data from 19 endplates were pooled and averaged together. QC was increased from 76.5 ± 3.6 to 113.3 ± 6.9 by d-TC infusion (p < 0.01, paired t test). F–G, Average EPC, mEPC, and QC are plotted over time during a brief block of AChRs via the application of d-TC from a wide-bore patch pipette. Current traces shown in G correspond to the filled symbols in plot F. Immediately after 3 μm d-TC was pressure puffed (20 psi, 1 s) to the endplate being voltage clamped, both EPCs and mEPCs were not detectable. As the washout continued, first the EPC, then the mEPC became detectable. QC was obtained as soon as mEPCs could be accurately detected. QC was maximal as soon as it could be calculated and then declined to baseline over 2–3 min as d-TC was washed out.

