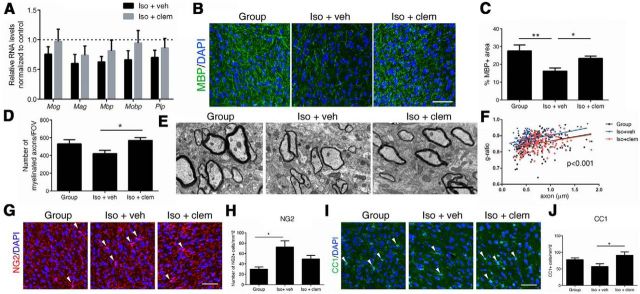
Figure 2.
Clemastine enhances myelination and oligodendrocyte differentiation in the PFC. A, Quantitative real-time PCR (qRT-PCR) of myelin gene transcripts in the PFC. Bar graphs indicate average values in isolated mice (n = 4 iso+veh, n = 6 iso+clem) after Gapdh and 18s normalization relative to average levels in group-housed mice (n = 4; dashed line). B, C, Confocal images and quantifications of MBP+ (green) myelinated fibers in PFC. DAPI (blue) was used as nuclear counterstain. Scale bar, 50 μm. *p < 0.05, **p < 0.01 by one-way ANOVA followed by Tukey's post hoc test, n = 12 fields from 3 mice per treatment condition. D, Quantification of myelinated axons per FOV in PFC using semithin transverse sections from group-housed (Group), iso+veh, and iso+clem mice. n = 18 fields from 3 mice per treatment condition. *p < 0.05 by one-way ANOVA followed by Tukey's post hoc test. E, EMs of axons in PFC from group-housed (Group), iso+veh, and iso+clem mice. Scale bar, 2 μm. F, Scatter plot of g-ratio values in the PFC in group-housed (Group; n = 183 axons), iso+veh (n = 154 axons), and iso+clem (n = 159 axons) mice. p < 0.0001 for group versus iso+veh; p < 0.0001 for iso+veh versus iso+clem; by one-way ANOVA followed by Tukey's post hoc test. n = 30 fields from 3 mice per treatment condition. G, H, Confocal images and quantifications of NG2+ (red) cells in PFC. DAPI (blue) was used as nuclear counterstain. Scale bar, 50 μm. I–J, Confocal images and quantifications of CC1+ cells in PFC. *p < 0.05 by one-way ANOVA followed by Tukey's post hoc test. Data are mean ± SEM.

