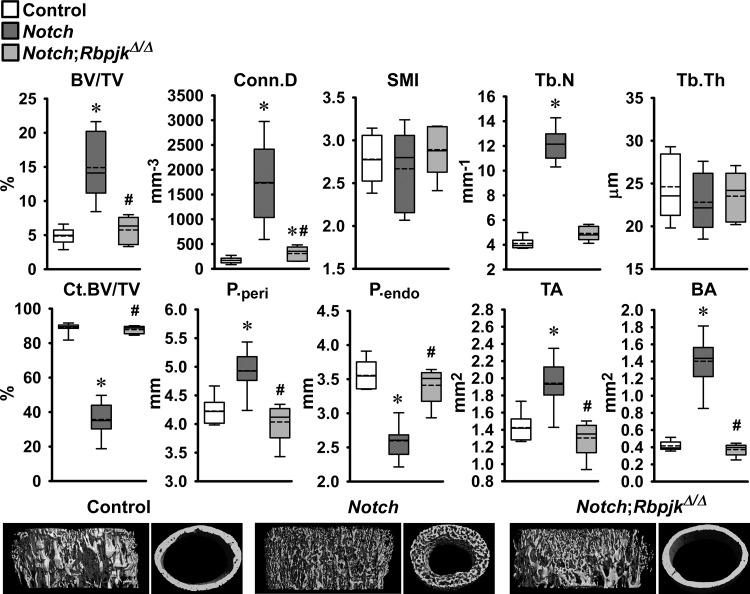
Fig. 3.
Femoral microarchitecture assessed by μCT analysis of the distal femur trabecular compartment (top) and femoral mid-shaft cortical bone (bottom) of 1-mo-old male Dmp1-Cre+/−;RosaNotch mice in an Rbpjκ intact background (Notch, dark gray boxes) and in the context of Rbpjκ deletion, Dmp1-Cre+/−;RosaNotch;RbpjκΔ/Δ (Notch;RbpjκΔ/Δ, light gray boxes), and control RosaNotch (control, open boxes) mice. Trabecular μCT parameters: bone volume/total volume (BV/TV), connectivity density (Conn.D), structure model index (SMI), and trabecular number (Tb.N) and thickness (Tb.Th). Cortical μCT parameters: cortical BV/TV (Ct.BV/TV), periosteal (P.peri) and endocortical perimeter (P.endo), and total (TA) and bone (BA) area. Dmp1-Cre+/−;RosaNotch and control mice were obtained from litters pooled over a period of ∼4 yr and included Dmp1-Cre+/−;RosaNotch matched to Dmp1-Cre+/−;RosaNotch;RbpjκΔ/Δ littermate mice (n = 5–12). Horizontal continuous lines represent the median and interrupted lines represent the mean; upper and lower limits of the box represent 75th and 25th percentiles. Whiskers (bars) indicate minimum and maximum values. *Significantly different from control RosaNotch mice; #Signficantly different between Dmp1-Cre+/−;RosaNotch and Dmp1-Cre+/−;RosaNotch;RbpjκΔ/Δ by Kruskal-Wallis test, P < 0.05. Representative μCT of cancellous and cortical bone from Dmp1-Cre+/−;RosaNotch (Notch) and Dmp1-Cre+/−;RosaNotch;RbpjκΔ/Δ (Notch;RbpjκΔ/Δ) and RosaNotch controls are shown on the bottom.

