Fig. 10.
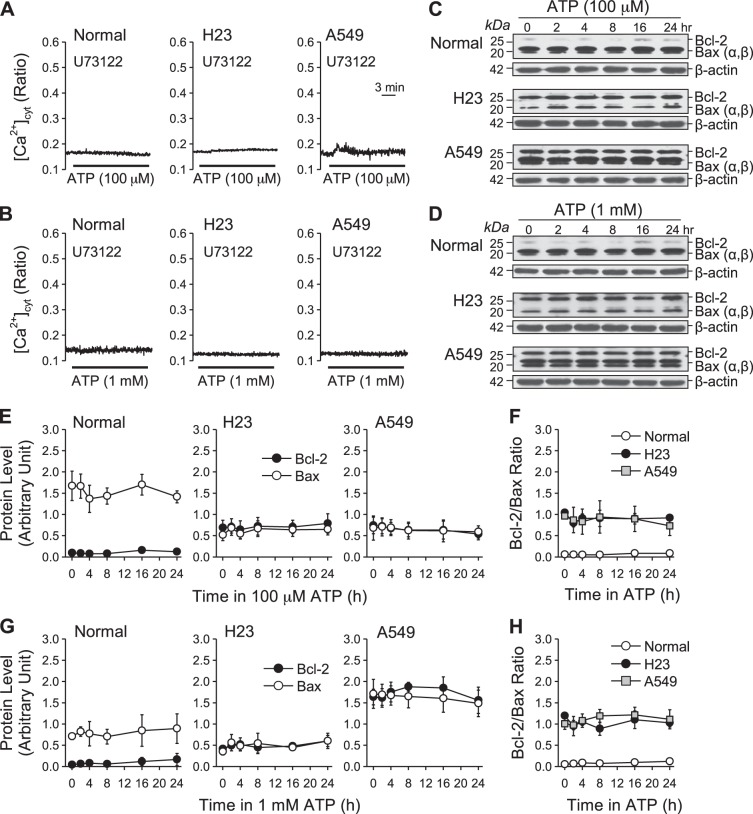
Effect of ATP on Bcl-2 and Bax expression and Bcl-2/Bax ratio in normal and lung cancer cells with treatment of U-73122. A: representative traces showing changes in [Ca2+]cyt in normal and lung cancer cells before, during, and after application of 100 μM ATP after treatment with 10 μM U-73122. B: representative traces showing changes in [Ca2+]cyt in normal and lung cancer cells before and after application of 1 mM ATP after treatment with 10 μM U-73122. C: Western blot analysis of Bcl-2 and Bax expression in normal and lung cancer cells treated with 100 μM ATP for 0, 2, 4, 8, 16, and 24 h after treatment with 10 μM U-73122. β-Actin was used as a control. D: Western blot analysis of Bcl-2 and Bax expression in normal and lung cancer cells treated with 1 mM ATP for 0, 2, 4, 8, 16, and 24 h after treatment with 10 μM U-73122. β-Actin was used as a control. E: summarized data (means ± SE) showing the changes of Bcl-2 and Bax expression level in normal and lung cancer treated 100 μM ATP for 0, 2, 4, 8, 16, and 24 h after treatment with 10 μM U-73122. F: summarized data (means ± SE) showing the changes of Bcl-2/Bax ratio in normal and lung cancer treated 100 μM ATP for 0, 2, 4, 8, 16, and 24 h after treatment with 10 μM U-73122 (n = 3). G: summarized data (means ± SE) showing the changes of Bcl-2 and Bax expression level in normal and lung cancer treated with 1 mM ATP for 0, 2, 4, 8, 16, and 24 h after treatment with 10 μM U-73122. H: summarized data (means ± SE) showing the changes of Bcl-2/Bax ratio in normal and lung cancer treated with 1 mM ATP for 0, 2, 4, 8, 16, and 24 h after treatment with 10 μM U-73122 (n = 3).

