Fig. 4.
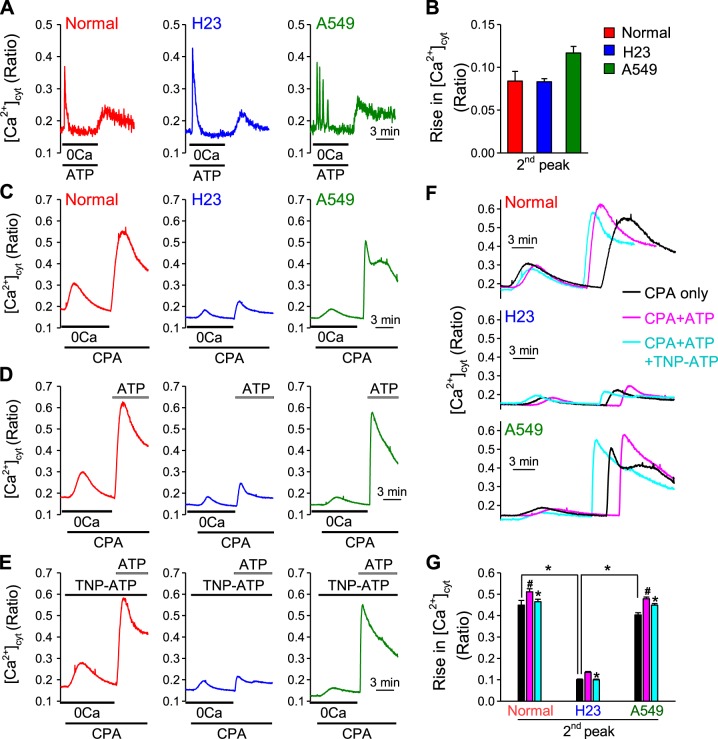
ATP-induced store-operated Ca2+ entry (SOCE) and extracellular Ca2+ influx in normal and lung cancer cells. A: representative traces showing changes in [Ca2+]cyt in normal and lung cancer cells treated with 100 μM ATP in the absence of extracellular Ca2+ and subsequent [Ca2+]cyt changes during and after application of 1.8 mM extracellular Ca2+. B: summarized data (means ± SE) showing the amplitude of increase in [Ca2+]cyt induced by 1.8 mM extracellular Ca2+ after application of 100 μM ATP in the absence of extracellular Ca2+ (n = 5, *P < 0.05 vs. Normal). C: representative traces showing changes in [Ca2+]cyt in normal and lung cancer cells before, during, and after application of 10 μM cyclopiazonic acid (CPA, an inhibitor of SERCA) and subsequent [Ca2+]cyt changes during and after application of 1.8 mM extracellular Ca2+. D: representative traces showing changes in [Ca2+]cyt in normal and lung cancer cells before, during, and after application of 10 μM CPA and subsequent [Ca2+]cyt changes during and after application of 100 μM ATP in 1.8 mM extracellular Ca2+. E: representative traces showing changes in [Ca2+]cyt in normal and lung cancer cells before, during, and after application of 10 μM CPA and subsequent [Ca2+]cyt changes during and after application of 100 μM ATP in 1.8 mM extracellular Ca2+ during treatment with 1 μM TNP-ATP (P2XR blocker). F: overlaid curves of C, D, and E. G: summarized data (means ± SE) showing the amplitude of second peak of [Ca2+]cyt increases in normal and lung cancer cells induced by 1.8 mM extracellular Ca2+ or 1.8 mM extracellular Ca2+ plus 100 μM ATP after the application of 10 μM CPA, and amplitude of second peak of [Ca2+]cyt increases in normal and lung cancer cells induced by 1.8 mM extracellular Ca2+ plus 100 μM ATP after the application of 10 μM CPA during TNP-ATP treatment (n = 3–10, *P < 0.05 vs. Control, #P < 0.05 vs. Normal).

