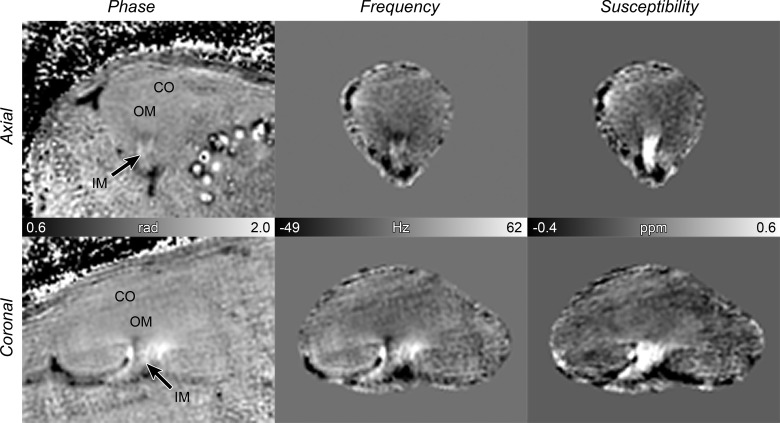
Fig. 1.
Quantitative susceptibility mapping (QSM) reconstruction process. First column: phase from complex data. Second column: local tissue frequency using the HARmonic (background) PhasE Removal using the LAplacian operator (HARPERELLA) method. Third column: QSM image using least-square algorithm using orthogonal and right triangular decomposition (LSQR) (grayscale bar = −0.4 to 0.6 ppm or −1.4 to 3.0 mM). Frequency and QSM were determined relative to the entire kidney, which was chosen as the reference tissue. Top row: axial view. Bottom row: coronal view. CO = cortex; OM = outer medulla; IM = inner medulla.

