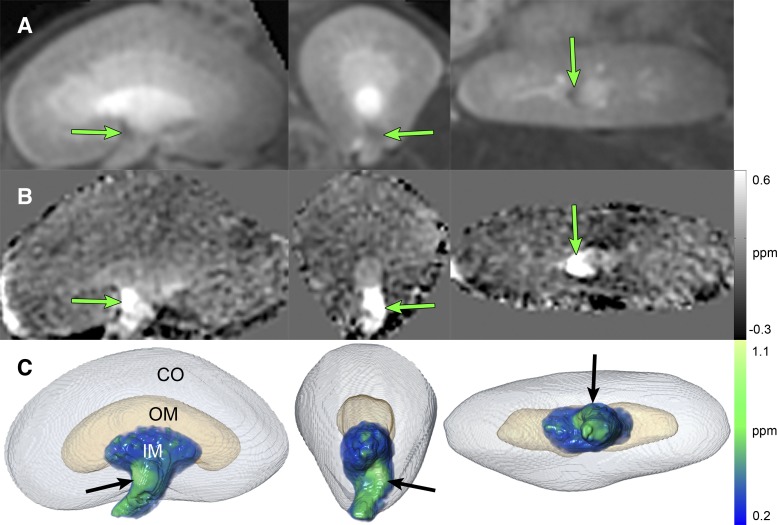
Fig. 3.
Views and volume rendering of the kidney at the peak enhancement time. First column: coronal view. Second column: axial view. Third column: sagittal view. A: magnitude. B: QSM (grayscale bar = −0.3 to 0.6 ppm or −1.2 to 3.0 mM). C: visualization of the CO as a surface rendering, OM as a surface rendering, and IM as a QSM volume rendering (color bar = 0.2 to 1.1 ppm or 1.0 to 5.2 mM). Arrows point to area of maximum enhancement.

