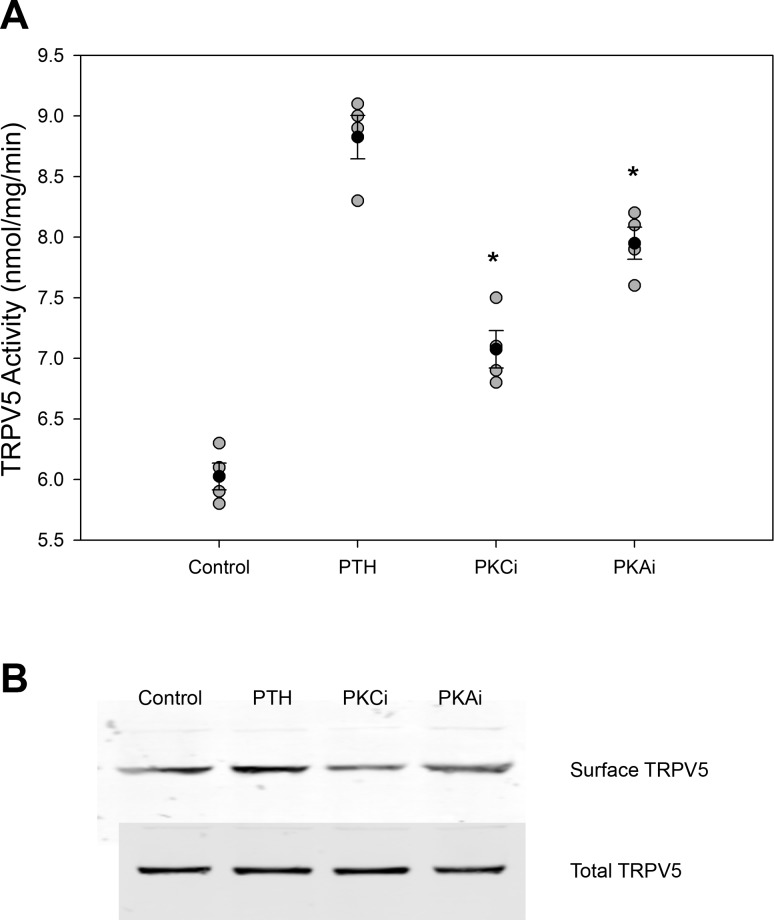
Fig. 3.
Effect of PTH on TRPV5 activity. A: TRPV5 activity with administration of 100nM PTH for 15 min and either vehicle (control), 500 nM Gö-6976 [a PKC inhibitor (PKCi)], or 1 μM H89 [a PKA inhibitor (PKAi); n = 4]. *P < 0.01 compared with PTH. Solid circles indicate means, shaded circles indicate individual data points, and bars represent SEs. B: representative blot showing TRPV5 surface and total expression for the above groups (n = 4).

