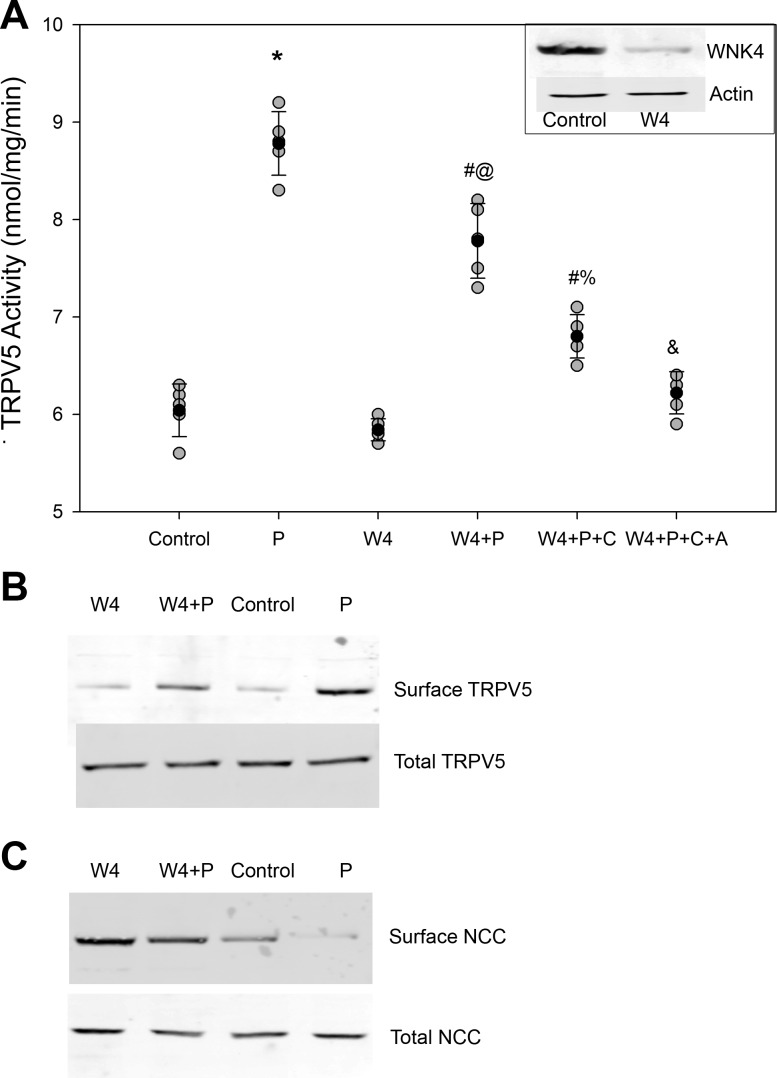
Fig. 6.
Effect of WNK4 knockdown on PTH stimulation of TRPV5 activity. A: TRPV5 activity with administration of 100 nM PTH for 15 min in control cells and mDCT15 cells with reduced WNK4 expression (W4). Inset, representative blot of WNK4 expression. Cells were treated with 100 nM PTH (P) for 15 min with and without inhibitors of PKC (C) and PKA (A). n = 4. *P < 0.01 compared with control; #P < 0.01 compared with W4; @P < 0.01 compared with P; %P < 0.01 compared with W4 + P + C; &P < 0.01 compared with W4 + P + C. Solid circles indicate means, shaded circles indicate individual data points, and bars represent SEs. B: representative blot showing TRPV5 surface and total expression for the above groups (n = 4). C: representative blot showing NCC surface and total expression for the above groups (n = 4).

