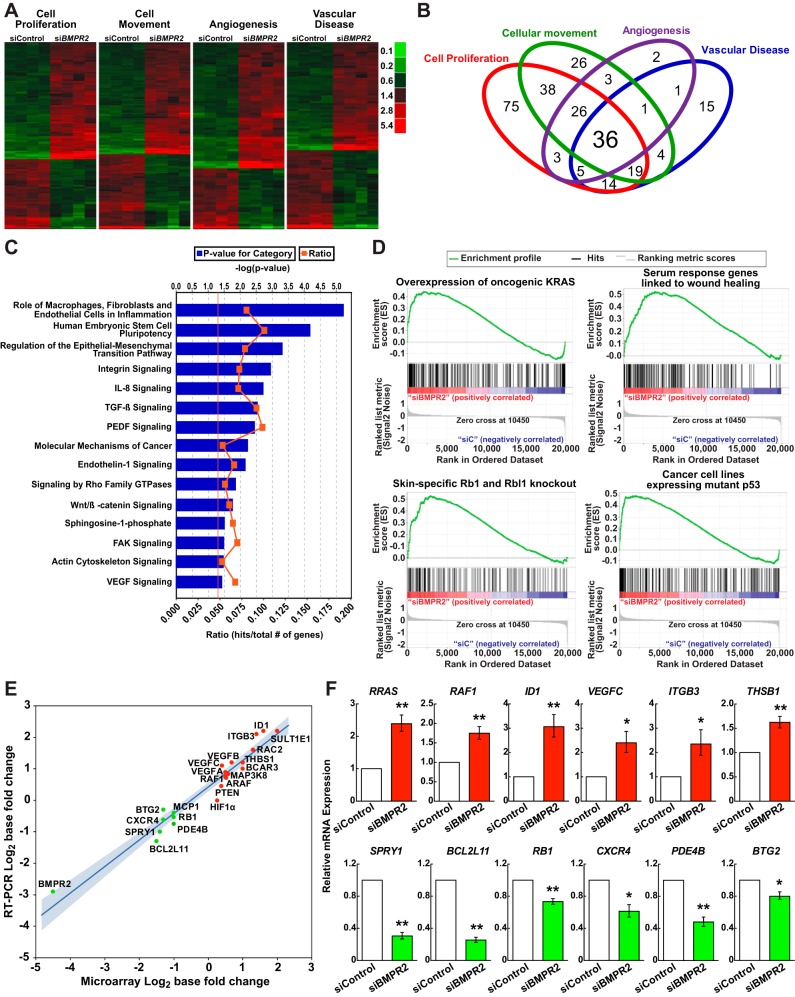
Fig. 2.
Thematic analyses of differentially expressed genes due to BMPR2 loss-of-function in HPAECs. A: differentially expressed genes within four top Bio Functions are displayed in heat map format: cell proliferation (n = 220 genes; P = 7.77 × 10⁻²⁰); cellular movement (n = 160 genes; P = 9.85 × 10⁻²⁵); angiogenesis (n = 77 genes; P = 1.92 × 10⁻¹⁹); and vascular disease (n = 96 genes; P = 6.45 × 10⁻²²). Red signifies expression above and green below the mean value within an individual row. For full annotations, see Supplemental Table S1. B: Venn diagram demonstrating overlap among the functional categories in A. C: canonical pathways significantly associated with BMPR2 loss-of-function. The vertical orange line represents the threshold for significance [−log10(P value) = 1.3 or P = 0.05]. D: gene set enrichment analysis enrichment plots of selected gene sets that are overrepresented following BMPR2 knockdown in HPAECs: 1) epithelial lung cancer cell lines overexpressing KRAS [normalized enrichment score (NES) = 1.48, P < 0.0001, false discovery rate (FDR) q value = 0.08]; 2) serum response genes linked to wound healing and cancer progression (NES = 1.61, P < 0.0001, FDR q value = 0.04]; 3) retinoblastoma 1 (Rb1) and retinoblastoma-like 1 (Rbl1) skin-specific knockout mice (NES = 1.70, P < 0.0001, FDR q value = 0.025); and 4) cancer cell lines expressing a p53 mutant (NES = 1.45, P < 0.0001, FDR q value = 0.086). The running enrichment score (y-axis) and position of gene set members on the rank-ordered list (x-axis) is shown. E: correlation plot, comparing microarray to qRT-PCR FCs expressed as log2 with the 95% confidence interval shaded in blue (P < 0.0001; R2 = 0.94). F: BMPR2 knockdown effect on 12 mRNA transcripts, as assessed by qRT-PCR in multiple HPAEC donors. Data are presented as the geometric means ± SE for 3 to 5 different donors. *P < 0.05; **P < 0.01.

