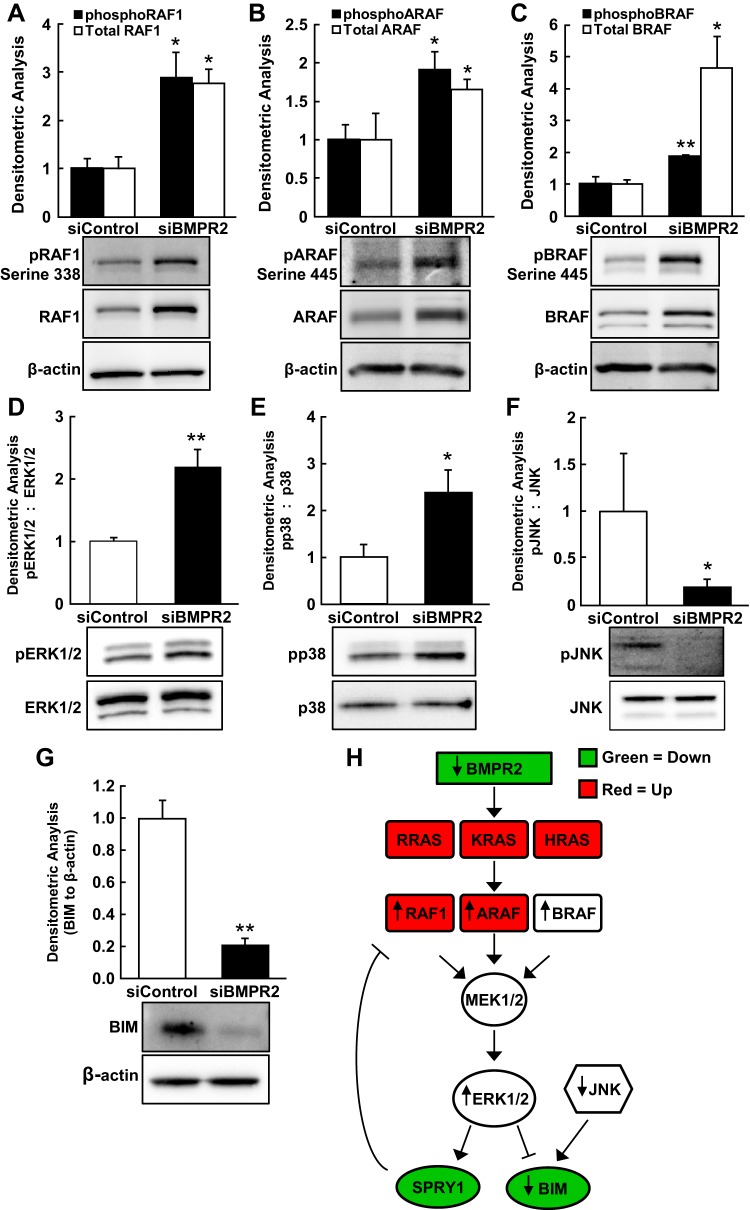
Fig. 3.
Aberrant activation of the Raf/ERK signaling pathway in BMPR2-silenced HPAECs. Lysates from control HPAECs and BMPR2-deficient HPAECs were resolved by SDS-PAGE and immunoblotted. pRAF1 (serine 338) and total RAF1 (3 independent experiments in 3 different donors) (A): pARAF (Ser-445) and total ARAF (n = 4) (B), pBRAF (Ser-445) and total BRAF (n = 4) (C), pERK, and total ERK (n = 6) (D), pp38 and total p38 (n = 4) (E), pJNK and total JNK (n = 4) (F), and BIM (BCL2L11; n = 4) (G). Densitometric analyses are normalized to the loading controls and the corresponding siControl condition. Representative blots are shown, and data are presented as means ± SE; *P < 0.05; **P < 0.01. H: schematic diagram of dysregulated Ras/Raf/ERK signaling resulting from BMPR2 loss-of-function. Red (up-regulated) and green (down-regulated) shading indicates the directional changes of significantly regulated transcripts [false discovery rates (FDR) < 0.01; no FC cutoff] by microarray. Black arrows (up or down) indicate experimentally determined directional changes in protein expression and/or activation state.

