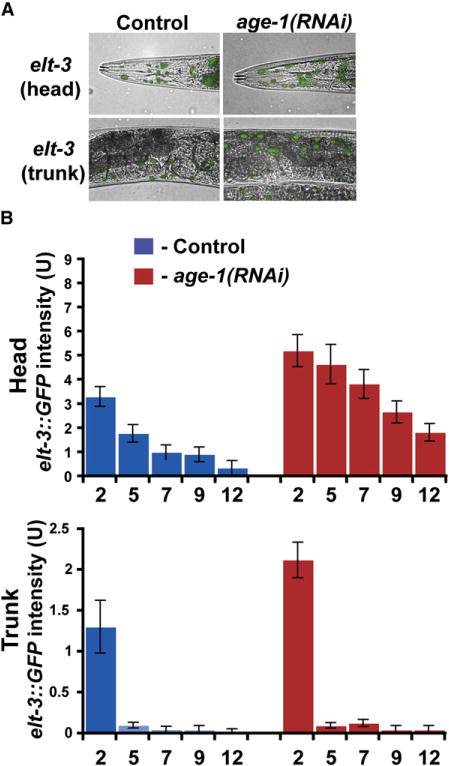
Figure 3. Regulation of elt-3 GATA by age-1.

(A) GFP expression of elt-3 in wild-type and age-1(RNAi) animals at day 3 of adulthood. Images show expression in the head and trunk regions. age-1(RNAi) results in increased elt-3 GATA expression in the head and trunk hypodermal cells but not in intestinal-rectal valve cells and the tail hypodermis. (B) Quantification of levels of elt-3::GFP expression from 20 worms in wild-type and age-1(RNAi) mutants at five times during aging. Expression levels were determined in the head area of the worm by measuring pixel intensity from GFP images.
Error bars represent the SEM pixel intensities.
