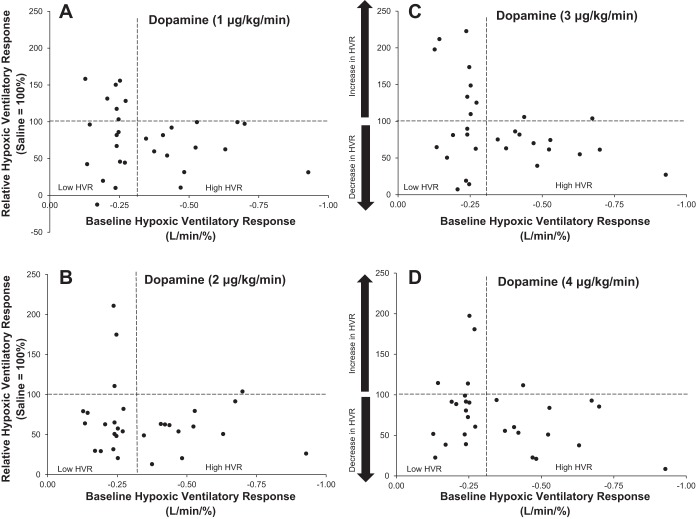
Fig. 3.
Variability in the effect of dopamine dose on the HVR. HVR data are presented relative to responses during saline infusion (saline = 100%). Values >100% indicate an increase in HVR with dopamine infusion at a given dose: 1 μg·kg−1·min−1 (A) 2 μg·kg−1·min−1 (B), 3 μg·kg−1·min−1 (C), and 4 μg·kg−1·min−1 (D). Values <100% indicate a decrease in HVR with dopamine infusion. Horizontal dashed lines represent baseline HVR (100%), and vertical dashed lines separate subjects into those with high and low baseline chemosensitivity (n = 30 total).

