Figure 1.
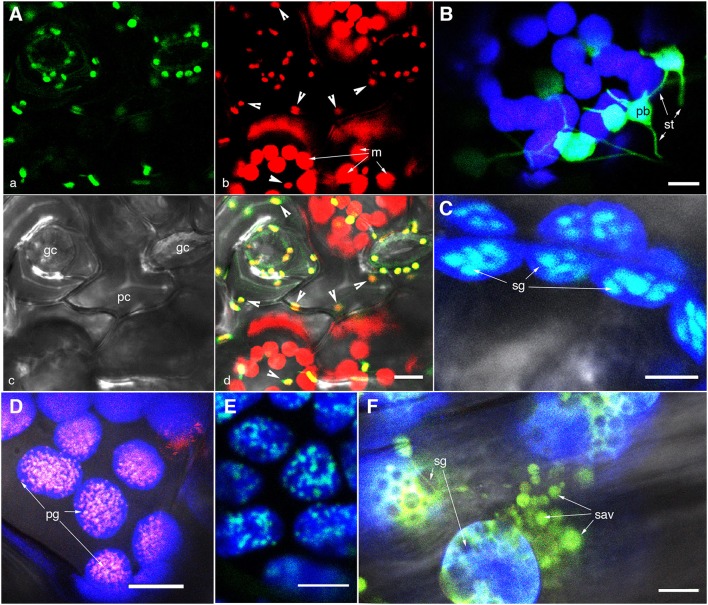
Representative images of fluorescently highlighted plastids and some sub-plastidic features. (A) A top-down view of epidermal and mesophyll chloroplasts in the upper epidermis of a green house grown Arabidopsis plant expressing the stroma-targeted tpFNR:GFP. Panel “a” shows the green fluorescent stroma (488 nm excitation; emission collected—509–520 nm). Panel “b” shows chlorophyll fluorescence in red (emission band 650–750 nm) in guard cells (gc), pavement cells (pc; arrowheads in b,d), and mesophyll cell (m) chloroplasts. Note the difference in size and the GFP signal intensity between the epidermal and mesophyll chloroplasts. (B) A view of thin stroma-filled tubules (stromules; st) and the bulky, grana-containing plastid body (pb) in epidermal chloroplasts of tobacco. (C) Starch grains (sg) in mesophyll chloroplasts highlighted in an Arabidopsis plant expressing a granule bound starch synthase (GBSS) fused to GFP. (D) Clusters of plastoglobuli (pg) observed in senescent leaves of Arabidopsis expressing a Fibrillin4:mEosFP fusion. (E) The highlighting of nucleoids in chloroplasts is indicated in a transgenic Arabidopsis plant expressing a plastid envelope DNA-binding (PEND) GFP fusion. (F) View of gerontoplasts in senescent leaves in an Arabidopsis plant expressing stroma-targeted tpFNR:GFP shows their swollen appearance suggesting compromised envelope membranes, degrading chlorophyll, the presence of starch grains (sg)visible as dark non-fluorescent regions and clusters of senescence associated vesicles (sav) containing fluorescently GFP-labeled storm content. Chlorophyll auto-fluorescence in (B–F) is false colored blue. Size bars = 5 μm in (B,C); 10 μm in (A,D,E,F).

