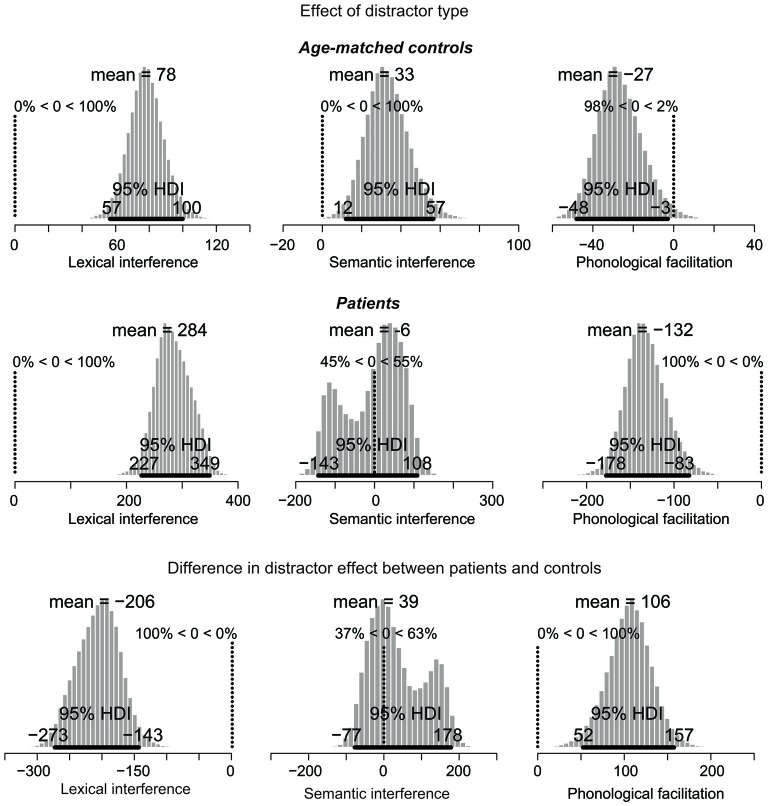
Figure 4.
Posterior distribution of differences in picture naming RTs as a function of distractor type for age-matched controls (top), lateral prefrontal cortex patients (middle), and for the difference between the two groups. The 95% highest density interval (HDI) is marked by the horizontal bar on the bottom of the distribution. The mean of the parameter values for each distribution is indicated on the top, followed by the percentage of parameter values that are greater or smaller than zero. For the difference in effects (bottom), decreased performance (i.e., larger interference and smaller facilitation effects) in patients relative to controls are represented by values smaller than zero. Increased performance (i.e., smaller interference and larger facilitation effects) are represented by values greater than zero. Note: Scales differ across the graphs.

