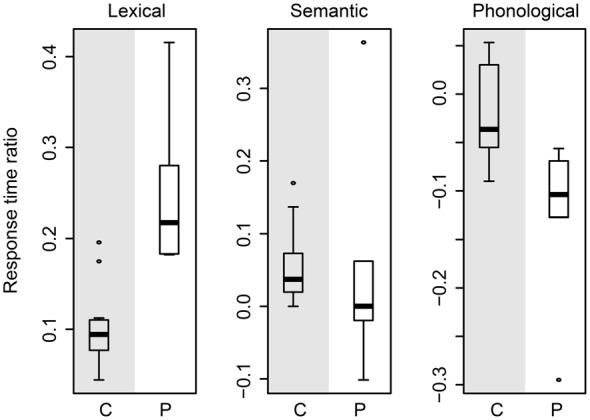
Figure 5.

Box-and-whisker plot of the response time ratios of the age-matched controls (gray-shaded panels) and of the patients (white-shaded panels) for the lexical (left plot), semantic (middle plot), and phonological (right plot) effects. C, controls; P, patients.
