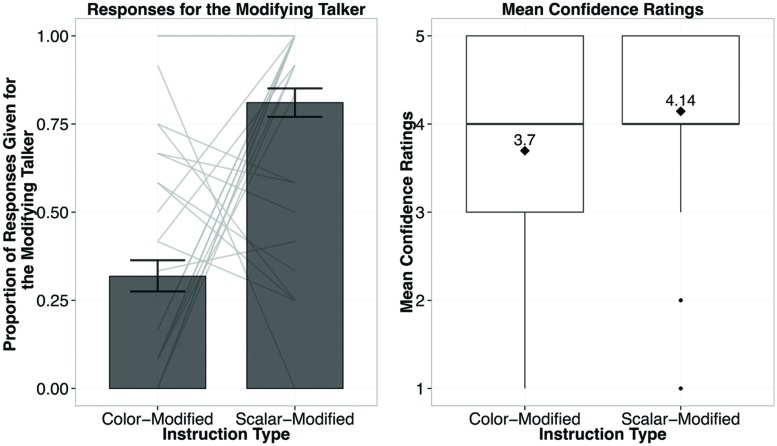
FIGURE 4.
Results from Experiment 2A, showing the proportion of responses given for the modifying talker by Instruction Type (left; light gray bars reflect individual participant means), and the confidence ratings for responses by Instruction Type (right; diamond dots reflect the mean rating out of 5).

