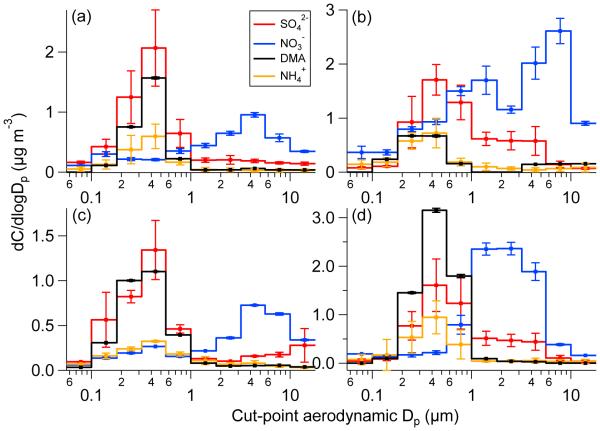
Fig. 1.
Speciated aerosol mass size distributions: (a) average of TACO sets 1–5, (b) average of TACO sets 6–11, (c) average of TACO sets 12–13, and (d) average of NiCE sets 1–10. Dimethylamine and nitrate concentrations are multiplied by 50 and 5, respectively. Error bars in panels a, b, and d represent one standard deviation and those in panel c are the range as there were only two sets.

