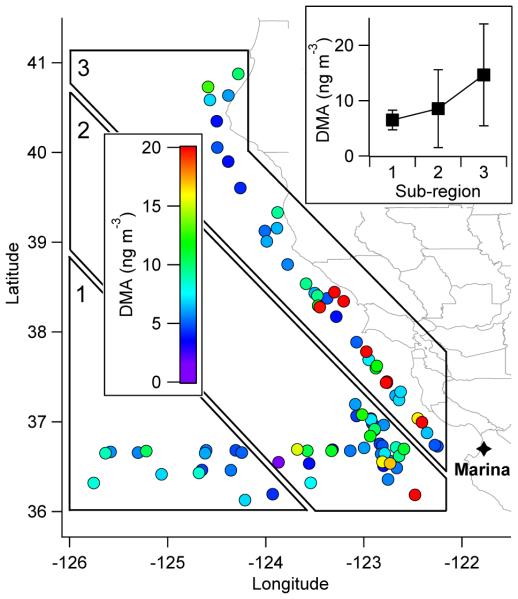
Fig. 6.
Spatial map of cloud water DMA air-equivalent mass concentration in the NiCE study region. The inset plot shows the average (± standard deviation) DMA concentration as a function of the distance to the coast as represented by the three subregions. Sub-regions 1, 2, and 3 have 15, 34, and 36 data points, respectively.

