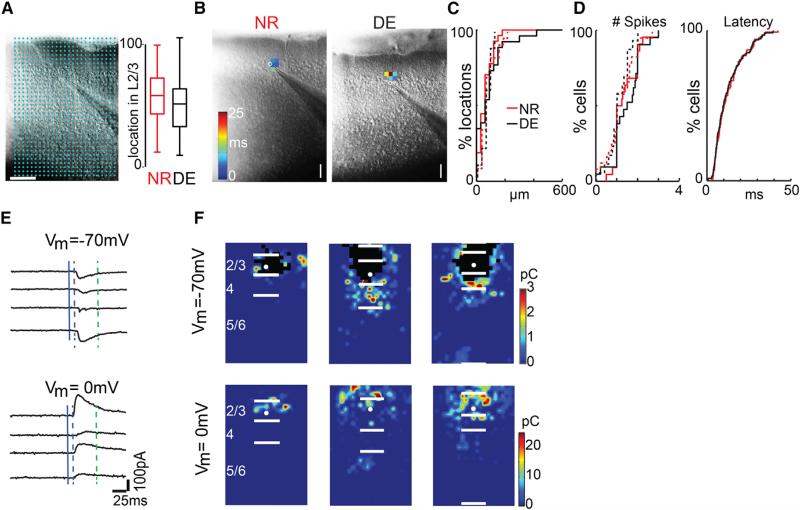
Figure 1. LSPS to Map Intracortical Connections to L2/3 Cells.
(A) (Left) Infrared image of brain slice with patch pipette on layer 2/3 neuron (left). Stimulation grid is indicated by blue dots. The scale bar represents 200 μm. (Right) Position of recorded neurons within layer 2/3 is shown. Plotted is the relative position within layer 2/3 with 0 referring to the border with layer 4 and 100 referring to the border with layer 1. Cells were sampled from the middle of layer 2/3 in NR and DE animals (p = 3.08–1; KS test).
(B) Measurement of spatial excitability profile by cell-attached recordings combined with photostimulation. Latencies for action potentials evoked in L2/3 neurons are encoded as pseudocolor. Note that action potentials were only evoked in a restricted area around the cell body. The scale bar represents 100 μm.
(C and D) Distribution of distance within which 80% action potentials evoked over the population of neurons in L2/3 (C, solid line; n = 27 NR; n = 26 DE) and L4 (C, dashed line; n = 27 NR; n = 26 DE), number of evoked action potentials (D, left graph; L2/3: solid line; L4: dashed line), and latency distribution of action potentials evoked in L2/3 neurons (D, right). Note that most spikes were evoked within 100 μm. The spatial excitation profiles (L2/3: p = 0.928; L4: p = 0.890; KS test) and numbers of evoked action potentials (L2/3: p = 0.731; L4: p = 0.660; KS test) of L2/3 and L4 neurons and latency distribution of L2/3 neurons (p = 0.996; KS test) were similar.
(E) Whole-cell voltage clamp recordings at holding potentials of –70 mV (top left) or 0 mV (top right) distinguish between photostimulation-evoked excitatory and inhibitory currents. Shown are traces obtained with photostimulation at different locations. Solid blue line indicates time of photostimulation; dashed blue line marks 8-ms post-stimulus, which is the minimal latency for synaptic responses; and dashed green line marks 50 ms, the end of the analysis window.
(F) Pseudocolor maps show PSC charge at each stimulus location for three cells. Direct responses indicated were set to zero. White filled circle marks the soma location. Horizontal bars indicate layer borders. Note that, although the maps can be diverse, most cells received input from within L2/3 and L4.

