Figure 3.

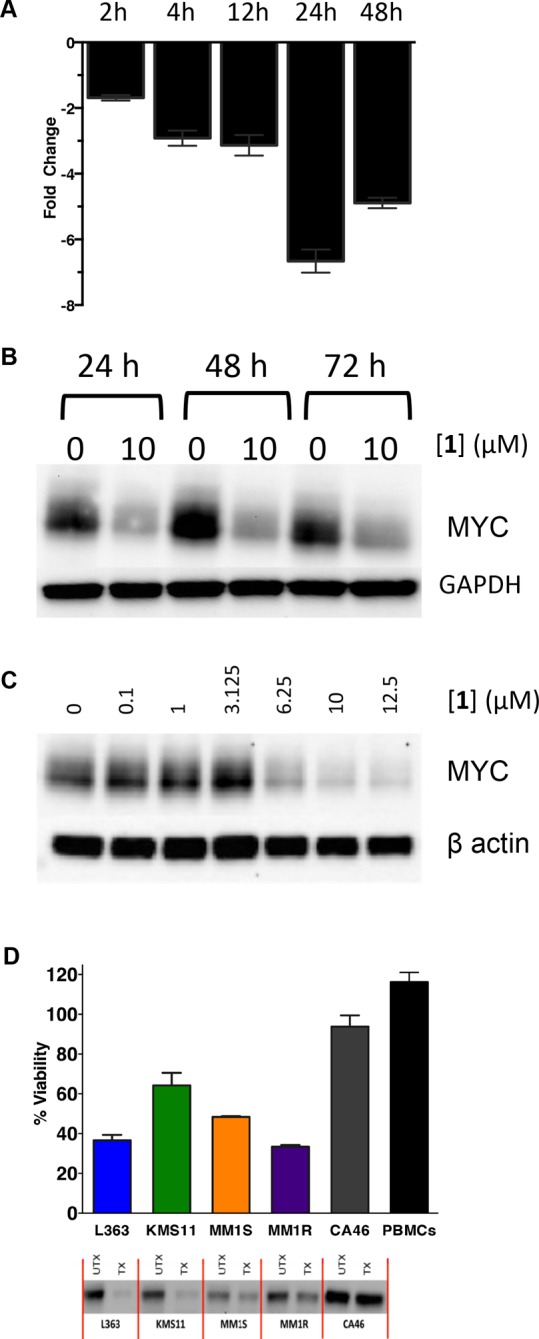
(A) Time-dependent inhibition of MYC transcription in myeloma cells after treatment with 10 μM 1, as measured by qPCR. Fold change is measured by the difference with respect to the untreated vehicle. Data are the average of two replicates, ± SEM. (B) Inhibition of MYC protein translation with 10 μM compound 1 is sustained over time. (C) MYC protein levels are inhibited as a function of the dose of 1. (D) Effects on cell viability and MYC protein translation by compound 1 across a panel of multiple myeloma cell lines. Also included are the resistant CA46 Burkitt’s lymphoma cell line and peripheral blood mononucleocytes. Data are the average of three replicates, ± SEM (n = 4).
