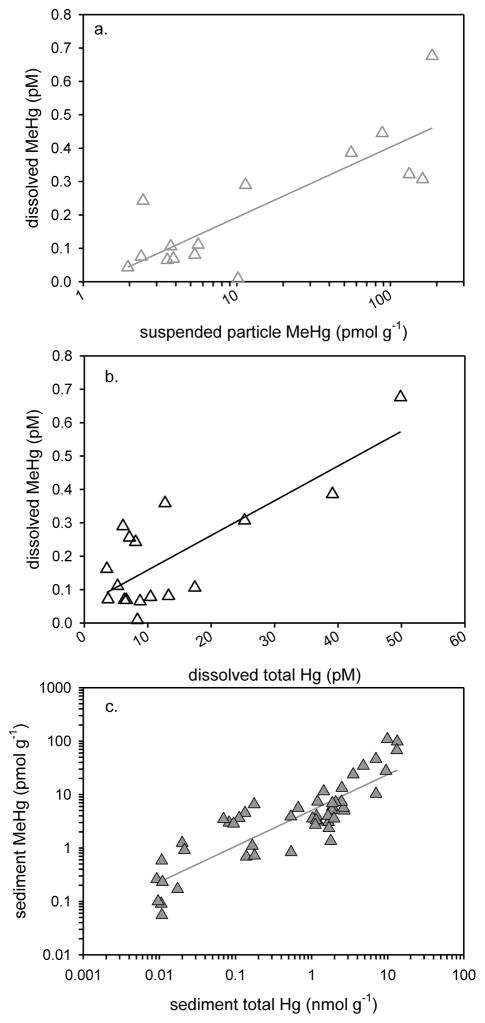
Figure 4.
July and August 2009 water column and sediment samples from Wells (ME), Portsmouth (NH), LIS (CT-NY) and Hackensack R. (NJ) assessed by linear regression: a. water column (surface & deep; 3–4 m) dissolved MeHg plotted against suspended particle MeHg (r2=0.650, P<0.0001, n=20, MeHg pM = 0.104 + (0.0024 * MeHg pmol g−1)), b. water column (surface & deep) dissolved MeHg plotted against dissolved total mercury (HgT) (r2=0.598, P<0.001, n=22, MeHg pM = 0.054 + (0.010 * HgT pM)), and c. sediment MeHg (0–6 cm) plotted against sediment HgT (r2=0.778, P<0.001, n=51, MeHg pmol g−1 = − 2.151 + (6.203 *HgT nmol g−1)). Each point is an individual sample and regression lines are plotted. LIS water column MeHg not included (see text for explanation).

