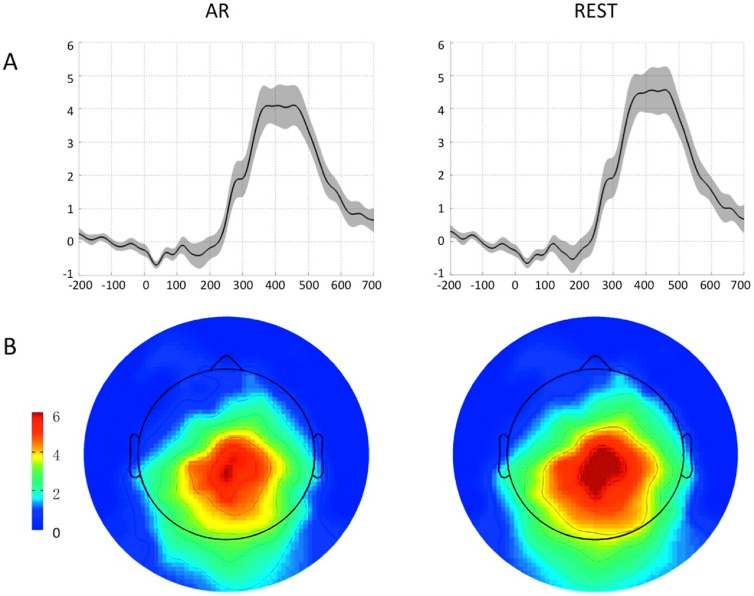
Figure 7.
Comparison of ERP responses reconstructed by AR and REST. We assessed the reliability of the P300 response across sixteen subjects. (A) ERP signals and related standard error (in shaded grey) across subjects for the Pz electrode; (B) topography of the Z-values for the P300 peak intensity across subjects, estimated using a Wilcoxon Signed Ranks Test.

