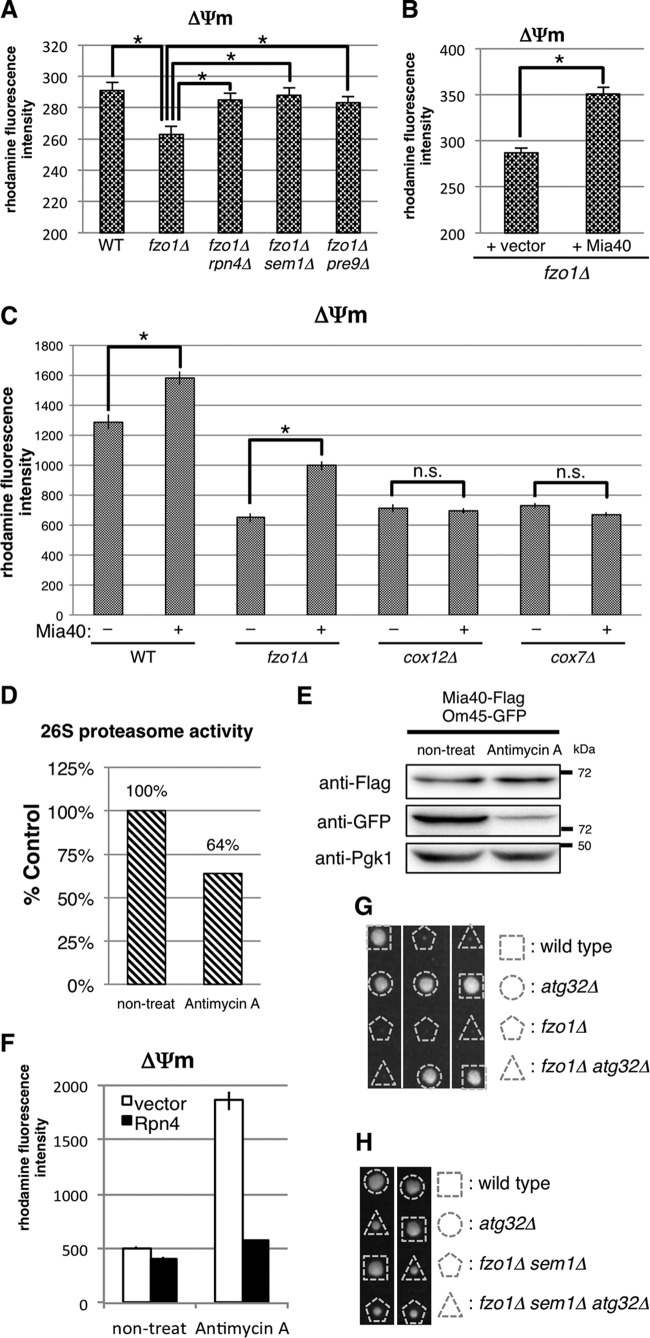
FIG 6.
Proteasome defects and Mia40 overexpression enhance mitochondrial membrane potential. (A to C) The indicated strains were stained with rhodamine 123, and fluorescence intensity was measured by FACS analysis. Mean fluorescence intensities ± standard deviations (SD) are shown. Asterisks indicate P < 0.01. (D) Proteasome activity of cells treated with antimycin A relative to control cells (100%). Proteasome activity was measured as in Fig. 1F. (E) Lysates of antimycin A-treated cells expressing chromosomally encoded Mia40-Flag and Om45-GFP were subjected to Western blotting using the indicated antibodies. Pgk1 was used as a loading control. (F) Mitochondrial membrane potential (ΔΨm) of normal and Rpn4-overexpressing cells treated with or without antimycin A. ΔΨm was measured as in panel A. (G) Spores of an FZO1/fzo1Δ ATG32/atg32Δ strain were dissected on YPAD prior to growth at 26°C for 4 days. Genotypes of each colony are shown. (H) Spores of FZO1/fzo1Δ SEM1/sem1Δ ATG32/atg32Δ strain were dissected on YPAD prior to growth at 26°C for 4 days. Genotypes of each colony are shown.

