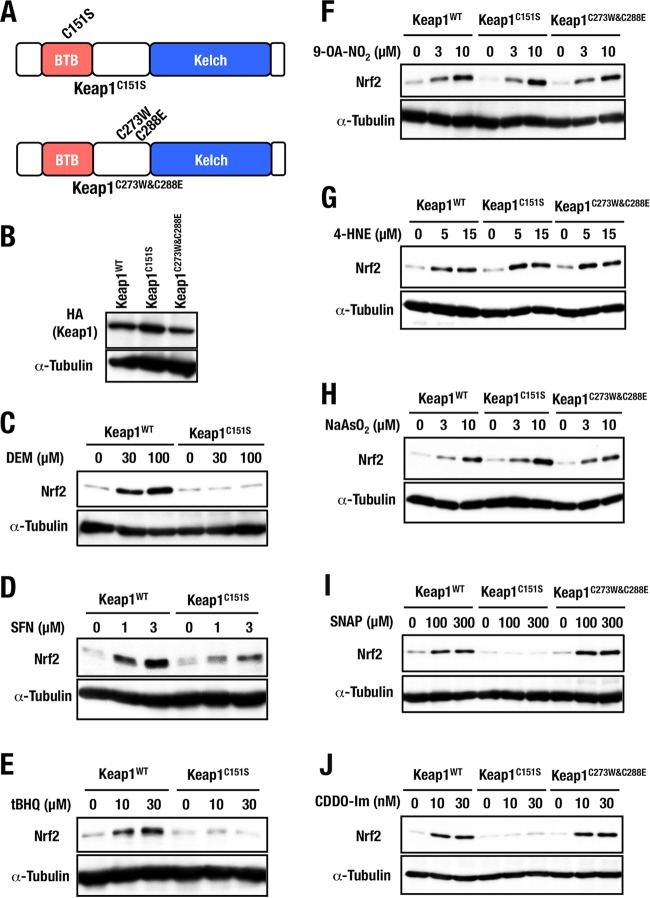
FIG 8.
Dissection of three major cysteine residues. (A) Schematic presentations of Keap1C151S and Keap1C273W&C288E structures. (B) Keap1C151S and Keap1C273W&C288E protein levels of stable complemented MEFs examined by Western blotting. (C to E) Keap1WT and Keap1C151S MEFs were treated with 0, 30, or 100 μM DEM (C), 0, 1, or 3 μM SFN (D), or 0, 10, or 30 μM tBHQ (E) for 3 h were examined by Western blotting. (F to J) Keap1WT, Keap1C151S, and Keap1C273W&C288E MEFs were treated with 0, 3, or 10 μM 9-OA-NO2 (F), 0, 5, or 15 μM 4-HNE (G), 0, 3, or 10 μM NaAsO2 (H), 0, 100, or 300 μM SNAP (I), or 0, 10, or 30 nM CDDO-Im (J) for 3 h were examined by Western blotting.

