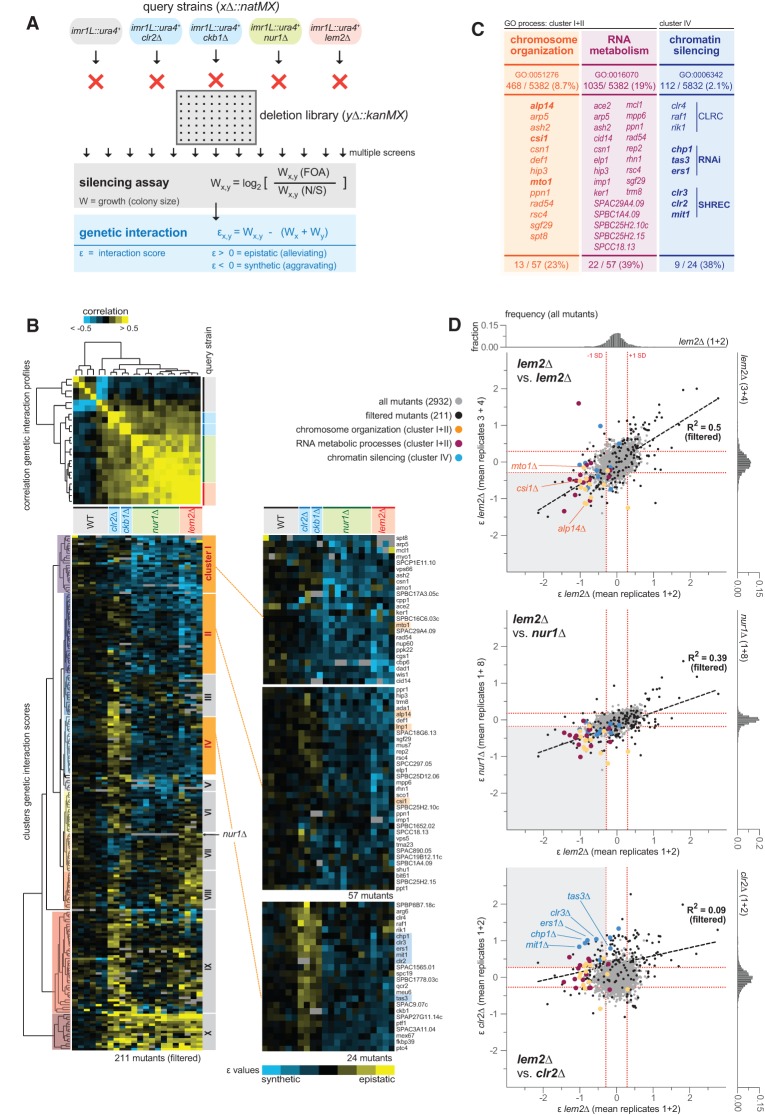
Figure 2.
lem2+ interacts genetically with multiple factors in transcriptional silencing. (A) Scheme illustrating the SGA approach with subsequent silencing reporter assays and determination of genetic interaction scores (ε values). For more information, see the text and Supplemental Figure S3. (B) Selected genetic interaction data after filtering (211 out of 2918) (see also Supplemental Fig. S3). (Top panel) Correlation matrix of the genetic interaction profiles. (Bottom panels) Interaction scores (ε values) analyzed by hierarchical clustering. (Blue) Negative ε values (synthetic interactions); (yellow) positive ε values (epistatic or suppressive interactions). (C) Gene ontology (GO) analysis for biological processes of genes identified in individual clusters. (D) Pairwise comparison of genetic interaction scores between averaged replicates of different query strains. Symbols in gray and black indicate all (2918) and selected (211) genetic interactions, respectively. Symbols in color show genetic interaction pairs for double mutants enriched for the GO terms depicted in C. The inset graphs at the top and at the right of each graph show the normal distribution of all genetic interactions (2918), with red lines demarcating ±1 standard deviation (SD) from the mean.

