Figure 5.
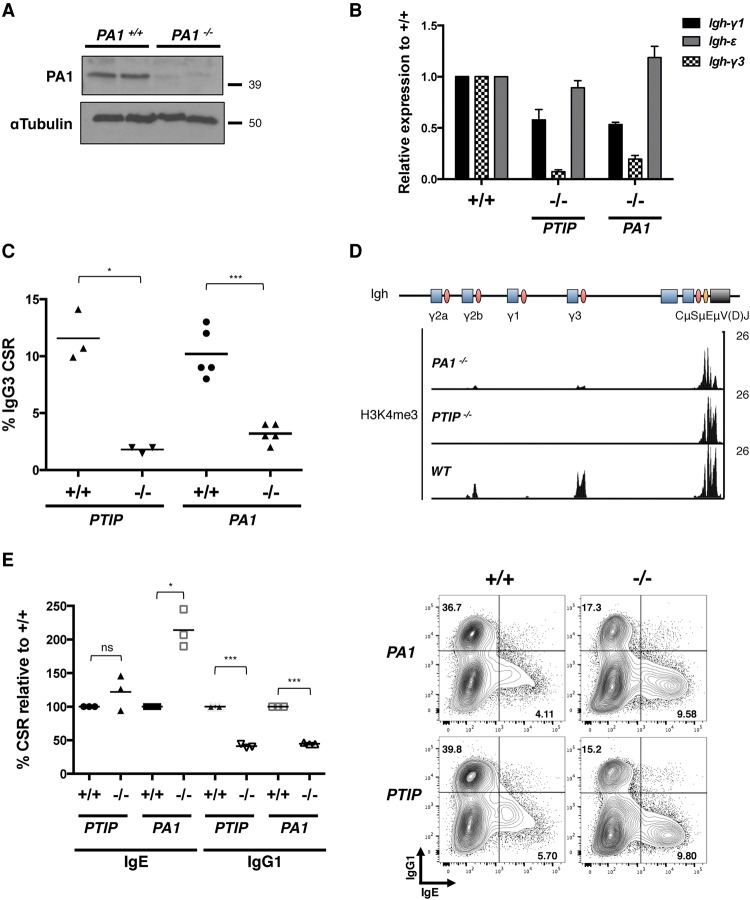
Immunoglobulin class switching defects in PA1−/− B cells. (A) Western blot from PA1−/− and control B cells showing the deletion efficiency of PA1. (B) Quantitative real-time PCR analysis of germline Igh-γ1 and Igh-ε transcription from B cells stimulated in the IgG1/IgE condition for 5 d and germline Igh-γ3 transcription from B cells stimulated in the IgG3 condition for 3 d. Data are from n = 3 mice of each genotype: PTIP+/+, PTIP−/−, PA1+/+, and PA1−/−. Data are from two independent experiments and are represented as mean ± SEM plotted relative to their respective wild type (+/+). (C) Dot plot depicting the frequency of IgG3+ cells after 3 d of culture from PTIP−/−, PA1−/−, and control mice as determined by flow cytometry. Each dot represents one mouse (n = 3 for PTIP mice; n = 5 for PA1 mice). Data are represented as mean. PTIP+/+ versus PTIP−/−, (*) P = 0.0155; PA1+/+ versus PA1−/−, (***) P = 0.0010. Statistics were performed using a two-tailed unpaired t-test with Welch's correction. (D) H3K4me3 ChIP-seq profiles across the Igh constant region locus in B cells stimulated in the IgG3 condition. Blue rectangles indicate constant region exon segments, pink ovals indicate switch regions, orange ovals indicate enhancers, and the black rectangle indicates the antigen recognition V(D)J gene segment. The μ, γ3, γ1, γ2b, and γ2a isotypes correspond to immunoglobulins IgM, IgG3, IgG1, IgG2b, and IgG2a. (E, left) Dot plot indicating IgE and IgG1 CSR as a percentage of wild-type (+/+) switching as determined by flow cytometry on day 5 of stimulation in the IgG1/IgE condition. Each dot represents one mouse (n = 3 for PTIP and PA1 mice). Data are represented as mean. IgE switching: PTIP+/+ versus PTIP−/−, P > 0.1, which is not significant (ns); PA1+/+ versus PA1−/−, (*) P = 0.0197. IgG1 switching: PTIP+/+ versus PTIP−/−, (***) P = 0.0008; PA1+/+ versus PA1−/−, (***) P = 0.0002. Statistics were performed using a two-tailed unpaired t-test with Welch's correction. (Right) Representative flow cytometry plots from one mouse of each genotype measuring IgG1+ frequency on the Y-axis and IgE+ frequency on the X-axis. See also Supplemental Figure 6.

