Figure 6.

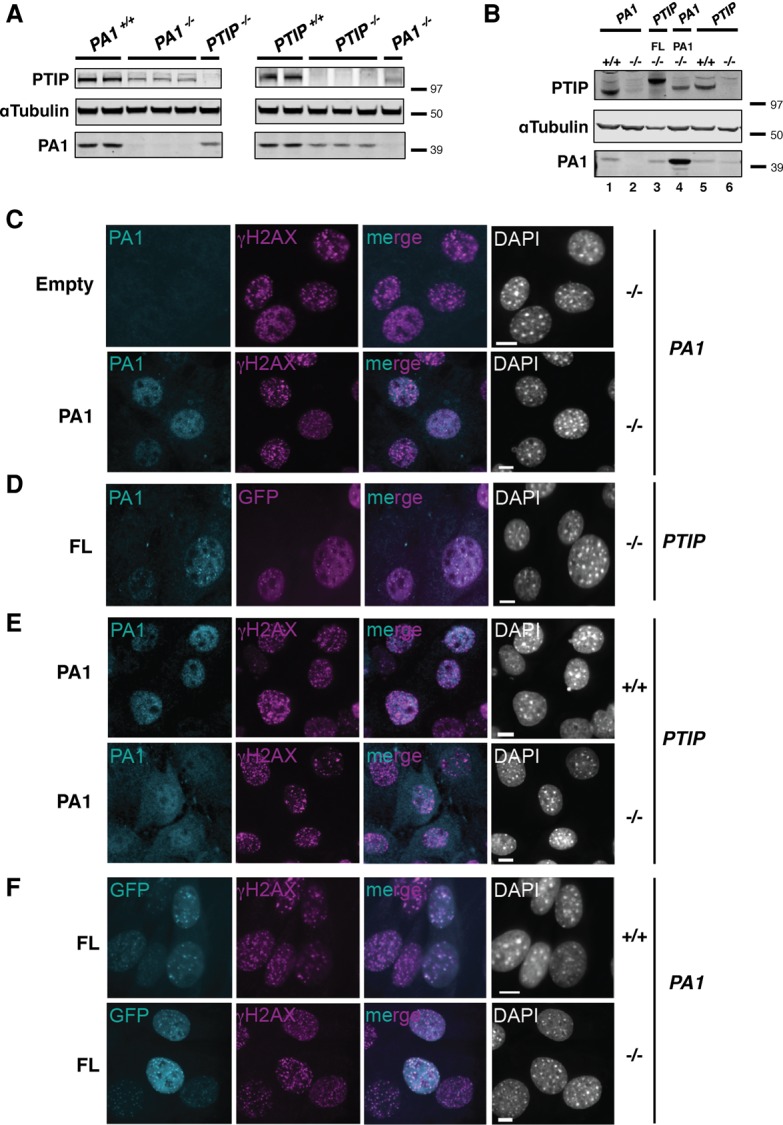
PTIP and PA1 protein stability and localization in cells. (A) A Western blot for PTIP and PA1 levels in B cells stimulated in the IgG3 condition for 3 d from individual PA1−/−, PTIP−/−, and control mice (PA1−/− and PTIP−/−, n = 3; control mice, n = 2). (B) A Western blot for PTIP and PA1 levels in immortalized PTIP−/−, PA1−/−, and control (+/+) MEFs transduced with FL and PA1. (C–F) Immunofluorescence of immortalized MEFs. (C) PA1−/− cells transduced with untagged PA1 or empty vector control. (D) PTIP−/− cells transduced with N-terminal GFP-tagged FL. (E) PTIP−/− and controls (+/+) transduced with untagged-PA1. (F) PA1−/− and controls (+/+) transduced with FL. MEFs in C–F were irradiated with 10 Gy, and FL (cyan, except for D, where FL is indicated in magenta), PA1 (cyan), and γH2AX (magenta) IR-induced foci were assessed 4 h after IR. DAPI is indicated in gray. Bars, 10 μm.
