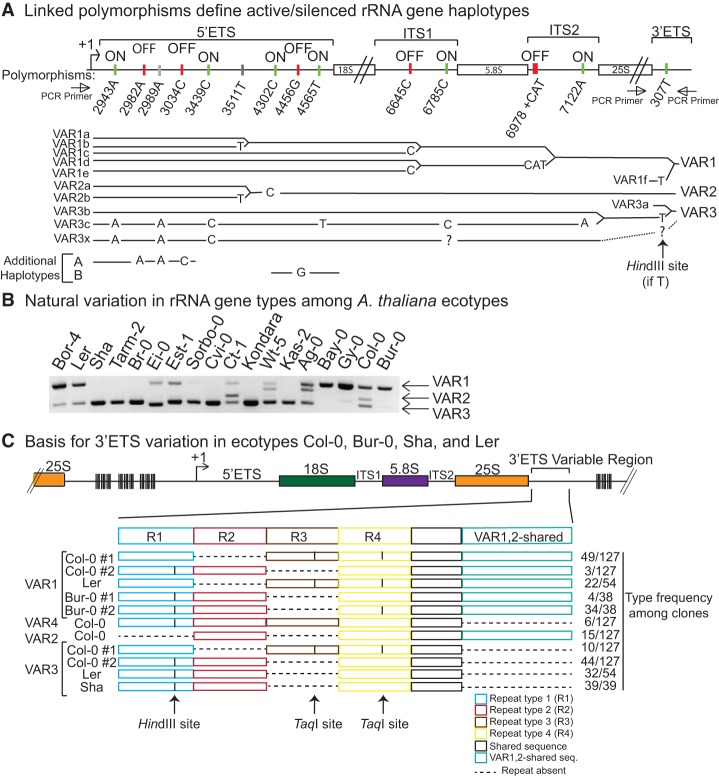
Figure 2.
rRNA gene subtype variation. (A) Expression status of gene subtypes represented by nucleotide polymorphisms and linkage of polymorphisms to define VAR class haplotypes. Polymorphic nucleotides present in expressed rRNA genes, based on RT-CAPS/dCAPS assays, are labeled “on,” whereas polymorphic nucleotides not detected in RNA of wild-type plants are labeled “off.” Polymorphisms associated with silent as well as active haplotypes are denoted by gray vertical tick marks. In the tree diagram, solid black lines denote identity to the reference sequence. Nucleotide polymorphisms relative to the reference sequence are shown and aligned with the diagram at the top that provides the position number. Dashed lines indicate undefined sequence intervals. Susceptibility of rRNA gene subtypes to digestion by HindIII, due to polymorphism 307T, is shown in Supplemental Figure S4. (B) Natural variation in rRNA gene variant type content in diverse A. thaliana ecotypes. The gel image shows PCR products obtained using the primer pair flanking the 3′ ETS variable region (see Fig. 1B). (C) Basis for 3′ ETS variation in A. thaliana ecotypes Col-0, Bur-0, Ler, and Sha. Independent clones of PCR products obtained upon amplification of the 3′ ETS variable region of Col-0, Bur-0, Ler, and Sha rRNA genes were sequenced (see Supplemental Fig. S5). The diagrams depict the presence or absence (dashed lines) of repeat motifs shown in different colors. The number of clones representing each subtype is provided at the right of the figure.

