Figure 4.
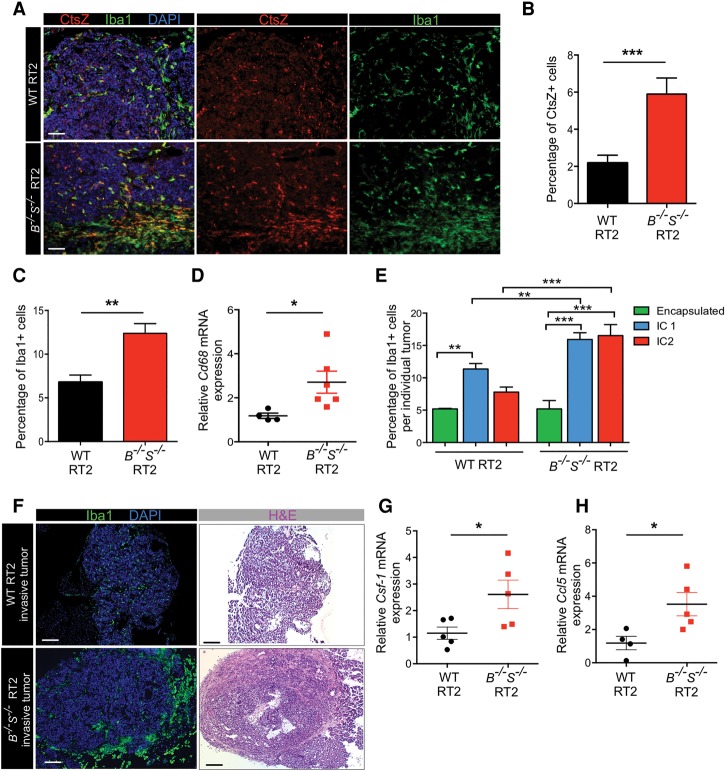
Macrophages expressing high levels of CtsZ infiltrate CtsB−/−S−/− tumors. (A) CtsZ is highly expressed in CtsB−/−S−/− RT2 tumors, and these tumors also show elevated macrophage numbers. Antibodies against CtsZ (red) and Iba1, a macrophage-specific marker (green), were used to identify cells expressing CtsZ and the presence of TAMs in wild-type RT2 and CtsB−/−S−/− RT2 tumors. CtsZ+ macrophages are particularly concentrated in the invasive edge of CtsB−/−S−/− RT2 tumors (evident in the lower images in the bottom panels). (B) Quantification of CtsZ+ cells in wild-type RT2 (n = 62) and CtsB−/−S−/− RT2 (n = 33) tumors relative to the total number of DAPI+ cells showed a significant increase in CtsB−/−S−/− RT2 tumors. (C) Quantification of Iba+ TAMs in wild-type RT2 (n = 108) and CtsB−/−S−/− RT2 (n = 28) tumors relative to the total number of DAPI+ cells showed a significant increase in TAMs in CtsB−/−S−/− RT2 tumors. (D) mRNA expression of the macrophage marker Cd68 was determined by qPCR analysis of wild-type RT2 (n = 4) and CtsB−/−S−/− RT2 (n = 6) whole tumors and revealed a significant increase in expression in CtsB−/−S−/− RT2 mice, consistent with the results in C. (E) Graph showing the macrophage content within and at the margin of individual tumors from wild-type RT2 and CtsB−/−S−/− RT2 mice, as determined by Iba1+ staining and according to each tumor invasive grade: encapsulated, IC1, or IC2 (as specified in Fig. 1E). (F) Low-magnification images of wild-type RT2 and CtsB−/−S−/− RT2 tumors stained with the macrophage-specific marker Iba1 (green) or hematoxylin and eosin (H&E), identifying the accumulation of TAMs at the margin of invasive CtsB−/−S−/− tumors compared with wild-type invasive tumors. (G,H) mRNA expression of the chemoattractants Csf-1 (G) and Ccl5 (H) was determined by qPCR analysis of wild-type RT2 (n = 4–5) and CtsB−/−S−/− RT2 (n = 5) whole tumors, which revealed a significant increase in expression of both genes in CtsB−/−S−/− RT2 mice. mRNA expression determined by qPCR was normalized to Ubiquitin C for each sample in D, G, and H. The graphs show mean ± SEM. Statistical significance was calculated by unpaired two-tailed Student's t-test. (*) P < 0.05; (**) P < 0.01; (***) P < 0.001. Bars: A, 50 µm; F, 200 µm.

