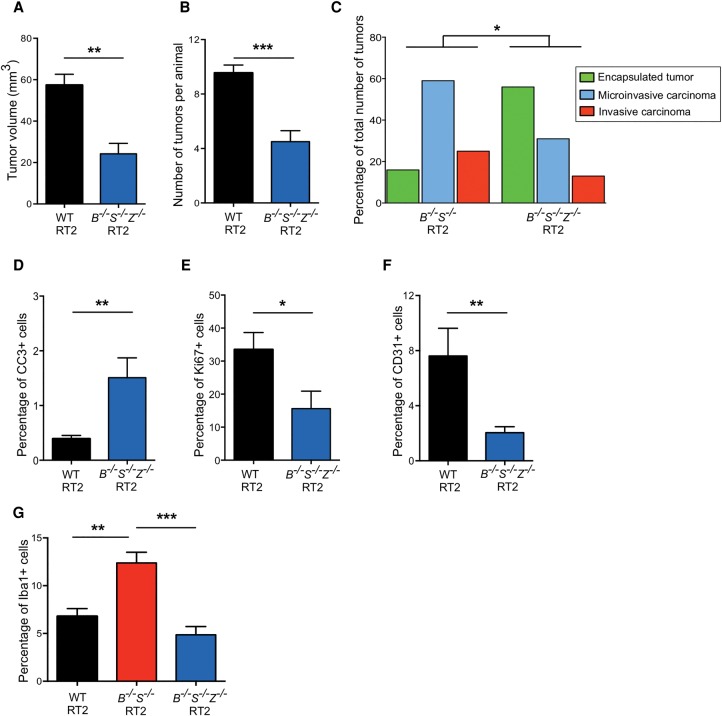
Figure 5.
Deletion of CtsZ in CtsB−/−S−/− RT2 animals reduces macrophage infiltration and tumor invasion. (A) Graph depicting the cumulative tumor burden, represented as the sum of the volumes of all tumors per mouse, in wild-type RT2 and CtsB−/−S−/−Z−/− RT2 animals at the 13.5-wk endpoint. Numbers of mice per group were as follows: wild-type RT2, n = 57; CtsB−/−S−/−Z−/− RT2, n = 14. (B) Graph depicting the average number of tumors per mouse in wild-type RT2 and CtsB−/−S−/−Z−/− RT2 animals at 13.5 wk. The following numbers of animals were analyzed per group: wild-type RT2, n = 58; CtsB−/−S−/−Z−/− RT2, n = 18. (C) Graph showing the proportions of encapsulated, microinvasive, and invasive carcinomas in CtsB−/−S−/− RT2 and CtsB−/−S−/−Z−/− RT2 mice at 13.5 wk. The following number of mice were analyzed: CtsB−/−S−/− RT2, 14 mice, 68 tumors; CtsB−/−S−/−Z−/− RT2, 13 mice, 32 tumors. (D) Quantitation of cleaved caspase-3 (CC3) staining in wild-type RT2 and CtsB−/−S−/−Z−/− RT2 tumors relative to the total number of DAPI+ cells revealed a significant 3.6-fold increase in apoptosis in tumors deficient for CtsB, CtsS, and CtsZ. Tumors from 11 wild-type RT2 and seven CtsB−/−S−/−Z−/− RT2 mice were analyzed. (E) Quantitation of Ki67 staining in wild-type RT2 (n = 5) and CtsB−/−S−/−Z−/− RT2 (n = 7) tumors relative to the total number of DAPI+ cells. This revealed a 53% decrease in cell proliferation in tumors simultaneously deficient for CtsB, CtsS, and CtsZ. (F) Quantification of CD31+ endothelial cells in wild-type RT2 (n = 4) and CtsB−/−S−/−Z−/− RT2 (n = 10) tumors relative to the total number of DAPI+ cells, as determined by immunostaining of tissue sections. This analysis revealed a significant decrease in tumor vascularization in CtsB−/−S−/−Z−/− RT2 mice. (G) Quantification of Iba+ macrophages in wild-type RT2 (n = 108), CtsB−/−S−/− RT2 (n = 28), and CtsB−/−S−/−Z−/− RT2 (n = 14) tumors relative to the total number of DAPI+ cells. This analysis revealed that the increase in TAM numbers observed in CtsB−/−S−/− RT2 tumors is reversed when CtsZ is deleted in these tumors.

