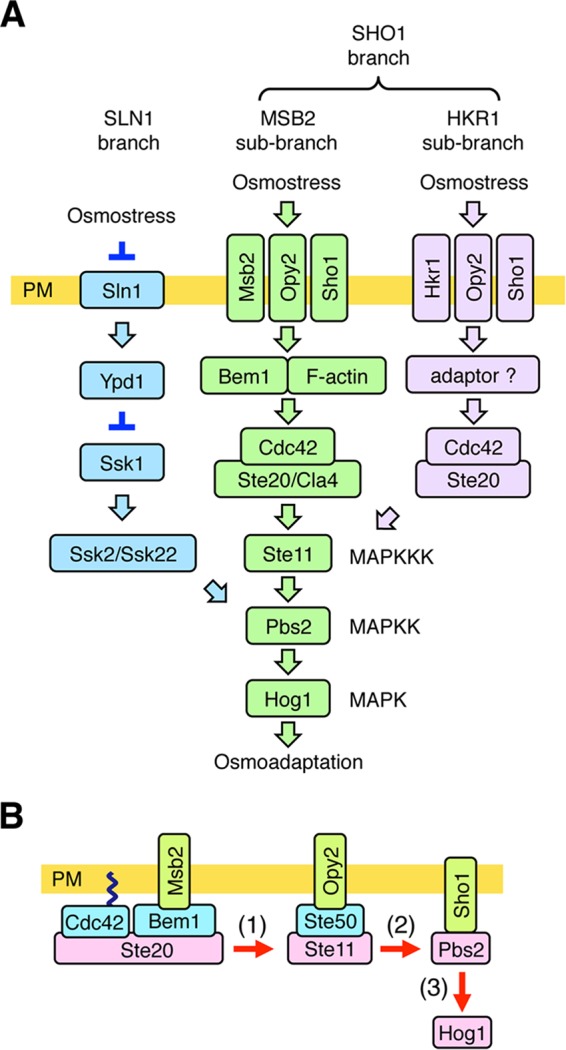
FIG 1.

Schematic model of the HOG pathway. (A) Proteins that are involved in the MSB2 subbranch are shown in green. Proteins that are specific to the SLN1 branch are colored blue, and those that are involved in the HKR1 subbranch are colored lavender. The proteins separated by a slash are functionally redundant. Not all the known components are shown. The yellow bar represents the plasma membrane (PM). Arrows indicate activation, whereas the inverted T-shaped bars represent inhibition. (B) A simplified schematic model of the MSB2 subbranch of the HOG pathway. Arrows indicate the flow of the signal by sequential phosphorylation.
