FIG 7.
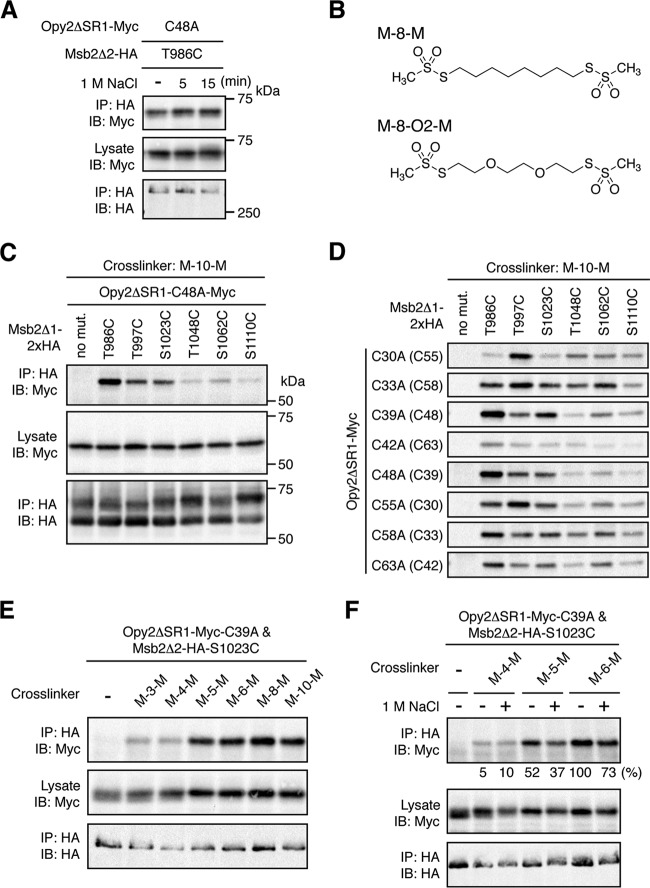
Probing the Opy2-Msb2 interaction using molecular rulers. (A) Effect of osmostress on direct disulfide bonding between Opy2 and Msb2. TM257 was cotransformed with plasmids that express the indicated mutants of Opy2ΔSR1-Myc and Msb2Δ2-HA under the control of the GAL1 promoter. The cells were exposed to 1 M NaCl for the indicated times. Preparation of cell lysates, immunoprecipitation, and immunoblotting were performed as described in the legend to Fig. 6E. (B) Structures of two molecular rulers. M-8-M, octane-1,8-diyl bismethanethiosulfonate; M-8-O2-M, 3,6-dioxaoctane-1,8-diyl bismethanethiosulfonate. (C and D) Chemical cross-linking between Opy2 and Msb2 using the bifunctional cross-linker M-10-M. KY595-2 was cotransformed with plasmids that express the indicated mutants of Opy2ΔSR1-Myc and Msb2Δ1-2×HA. Expression of these proteins is under the control of the GAL1 promoter. The cells were grown in CARaf medium, and expression of the tagged Opy2 and Msb2 was induced by 2% galactose for 2 h. The intact cells were treated with 0.4 mM M-10-M for 5 min at 30°C. Cell lysates were prepared using lysis buffer containing 0.2% Triton X-100. Immunoprecipitation and immunoblotting were conducted as described in the legend to Fig. 6E. Total expression levels of the epitope-tagged Opy2 and Msb2 proteins were uniform among the samples but are not shown in panel D to save space. (E and F) Cross-linking between Opy2 and Msb2 using bifunctional cross-linkers of different lengths. TM257 was cotransformed with plasmids that express Opy2ΔSR1-Myc-C39A and Msb2Δ2-HA-S1023C. The cells were grown in CARaf medium, and expression of the tagged Opy2 and Msb2 was induced by 2% galactose for 2 h. The intact cells were treated with the indicated bifunctional cross-linkers (0.4 mM) for 5 min at 30°C. Preparation of cell lysates, immunoprecipitation, and immunoblotting were conducted as described in the legend to panel C. (F) Cells were exposed (+) or not (−) to 1 M NaCl during the cross-linking reaction. The intensities of the cross-linked Opy2-Myc (top row) were quantified using ImageJ software (37) and normalized to the intensities of the corresponding total Opy2-Myc (middle row). The intensity of the strongest band was set to 100%, and the intensity of each band relative to that of the strongest band is shown below the top row.

