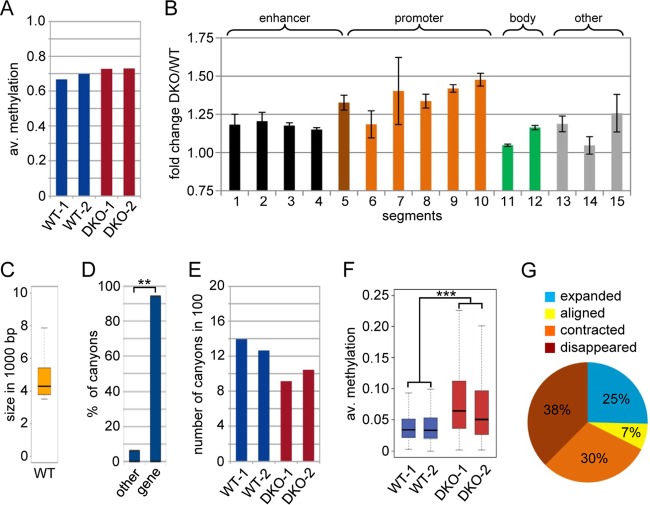
FIG 1.
Methylome of WT and DKO MEFs. (A) Average (av.) methylation ratios of the WT-1, WT-2, DKO-1, and DKO-2 samples. (B) Methylation changes at various subgenomic features shown as fold changes of the average methylation (DKO versus wild type; two replicates). ChromHMM (43) was applied to published ChIP-seq data sets (22, 23) to partition the wild-type MEF genome into 15 chromatin states, and methylation ratios for these genomic segments were calculated. All the segments (except E14) showed variable but significant (P < 0.01; Wilcoxon rank sum test) hypermethylation in DKO MEFs (see Fig. S2 in the supplemental material for a detailed description of segments and values). The error bars represent standard deviations. (C) Box plot showing the size distribution of all canyons. The box shows all canyons between the first and third size quartiles of the data set, whereas the line inside the box depicts the median for the canyon size. The ends of the whiskers mark the minimum and maximum sizes observed. (D) Canyons are strongly and significantly (**, P < 0.01; χ2 test) associated with transcription start sites. (E) Numbers of DNA methylation canyons in WT-1, WT-2, DKO-1, and DKO-2 cells. (F) Box plot showing average methylation ratios of canyons in WT-1, WT-2, DKO-1, and DKO-2 cells. The difference between the wild-type and DKO replicates is highly significant (***, P = 2.2 × 10⁻¹⁶; two-sided paired t test). (G) Pie chart showing canyon size dynamics in DKO MEFs.

