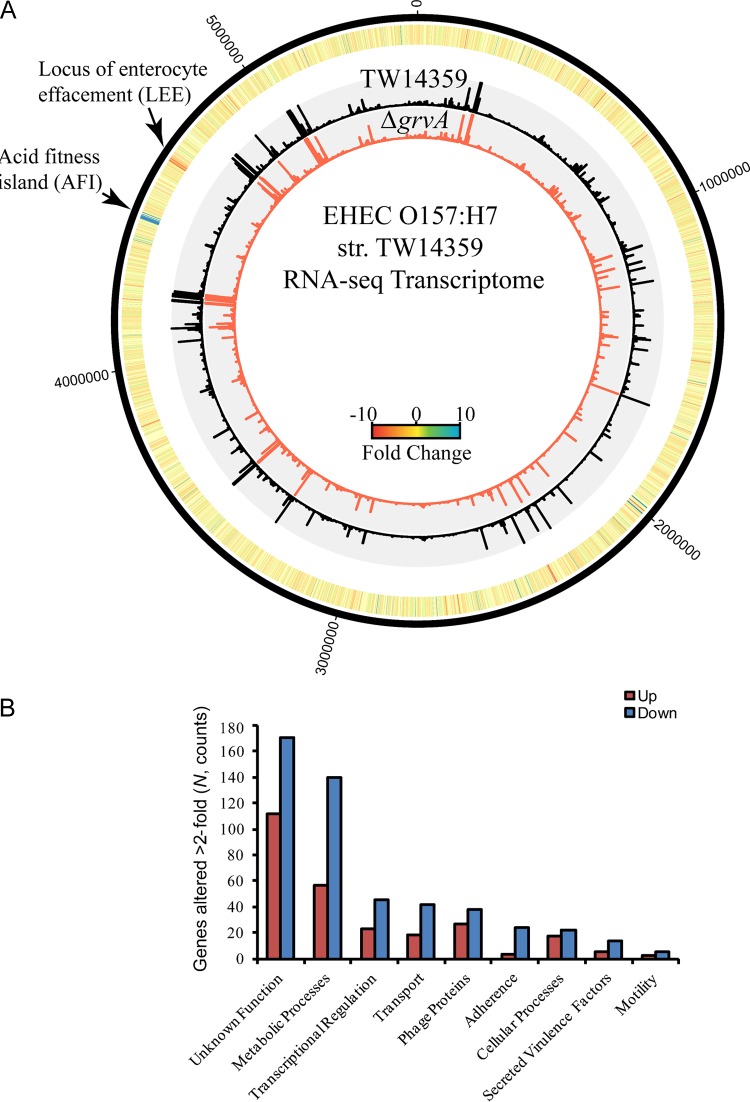
FIG 2.
The GrvA regulon in EHEC strain TW14359. (A) Circular plot of RNA-seq data for EHEC strains TW14359 and TW14359 ΔgrvA. Nucleotide positions are based on the TW14359 annotation (GenBank accession number NC_013008.1), indicated by the black outer ring. The heat map denotes the fold change in RPKM for TW14359 ΔgrvA relative to the level of expression in TW14359 for each gene. The two inner histograms indicate the RPKM values of TW14359 (black) and TW14359 ΔgrvA (red). Plots were generated using Circos (version 0.65; http://www.circos.ca). (B) Number of genes in grvA whose expression is altered relative to their expression in TW14359 plotted for each ontological group. The levels of expression of a total of 765 genes were altered by ≥2-fold; upregulation and downregulation are indicated.

