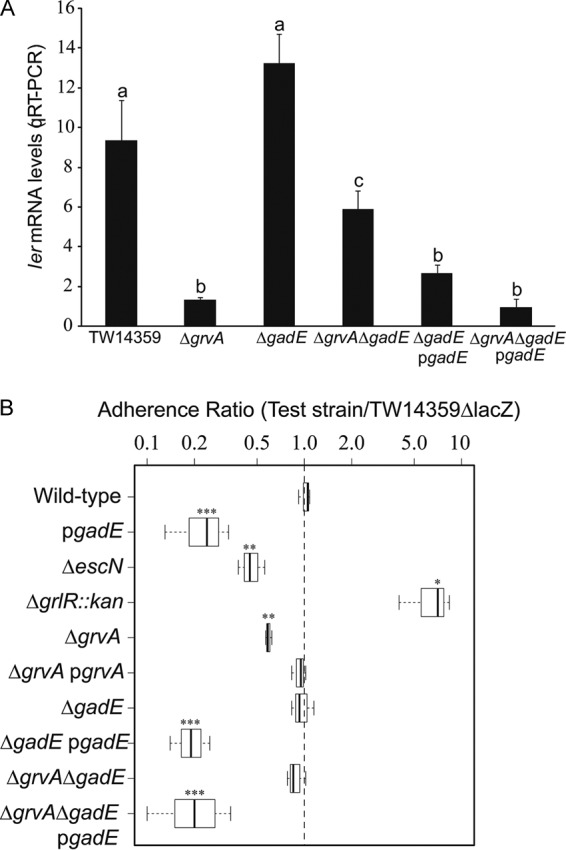
FIG 3.

GrvA requires gadE for control of LEE-dependent adherence. (A) ler transcript levels determined by qRT-PCR plotted for TW14359, TW14359 ΔgrvA, TW14359 ΔgadE, TW14359 ΔgrvA ΔgadE, and complemented strains TW14359 ΔgadE/pgadE and TW14359 ΔgrvA ΔgadE/pgadE grown in DMEM (OD600 = 0.5). Plots which differ by lowercase letter differ significantly by Tukey's HSD test following a significant F test (n ≥ 3, P < 0.05). Error bars denote standard deviations. (B) Adherence ratio box plot for test strains (TW14359 and genetic derivatives) relative to control strain TW14359 ΔlacZ when cultured with HT-29 colonic epithelial cells (see the text for details). Box plot boundaries represent the 25th and 75th percentiles, whiskers represent the maximum and minimum values, and the mean adherence ratio is given by the horizontal line. Asterisks denote a significant difference compared with the results for TW14359, as determined by t test (n ≥ 3; *, P < 0.05; **, P < 0.01; ***, P < 0.001).
