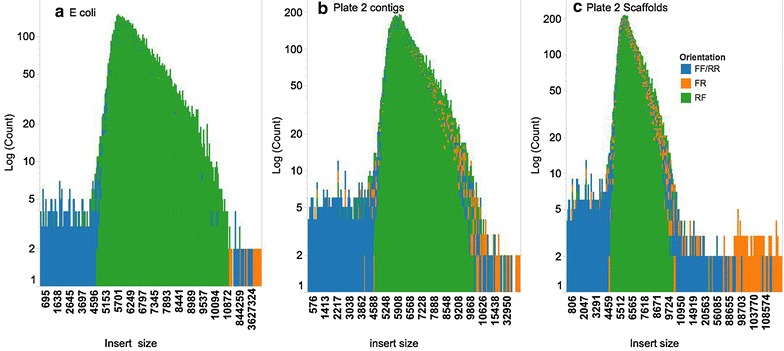
Fig. 5.

Distribution and orientation of MP insert sizes on E coli (a), contigs (b) and scaffolds (c) of 96 wheat BAC pools. Y axis (MP read counts in log scale), X axis (insert sizes). Correctly orientated MP reads with orientation RF (< –, – >) are shown in green, shadow library MP reads mapping with orientation FR (– >, < –) are shown in orange and chimeric MP reads mapping with orientation FF (– >, – >) and RR (< –, < –) are shown in blue
