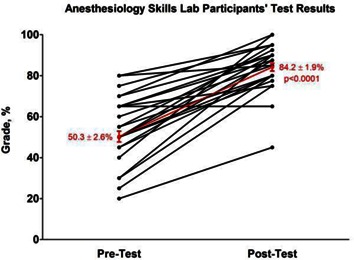
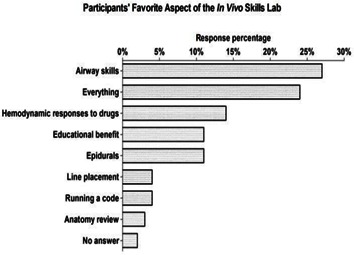
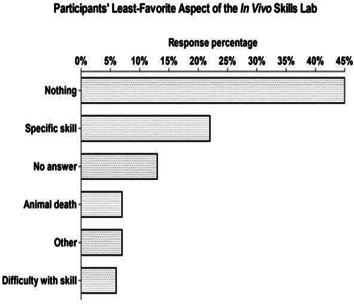
Figure 2.


Residents’ test scores and course evaluations. A, data from n=39 residents (2010-2012 courses) demonstrates the improvement in their 20-question assessment tests before and after their participation in the anesthesiology in vivo skills lab. Mean test scores ± SEM is in red. p < 0.0001 via a Wilcoxon matched pairs test. Thirty nine distinct lines are not visible on the graph due to some participants having overlapping pre- and post-test scores; B, the results of course evaluations from n=55-70 participants from 5 skills labs (2008-2012). Criteria were rated on a scale of 1 (poor) to 5 (excellent). Data is presented as the mean ± SEM; C, the results of the participants favorite aspects of the course (n=55 responses); D, the results of the participants least-favorite aspects of the course (n=55 responses).
