
Fig. 1.
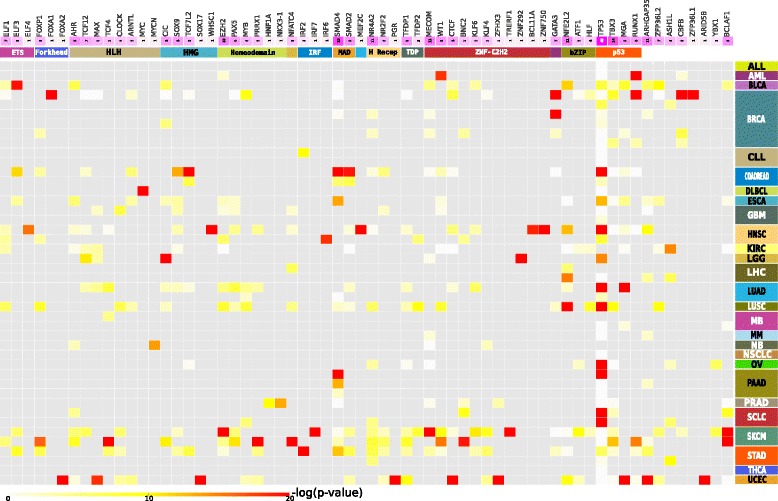
Enrichment for mutations of driver TFs across the 48 cohorts of tumors. The color scale of the cells follows the -log(P value) of Fisher’s test (see color legend at the bottom). Column color annotations from top to bottom represent the number of cohorts where the TF is identified as driver (the darker the purple, the more cohorts) and the family of the TF. The abbreviations used, and full names of families of each TF appear in Additional file 2: Table S1. Row color annotations represent the cohorts of tumors where the driver TFs were detected, with different colors symbolizing cohorts of tumor of different tumor types, the acronyms of which are detailed in the list of abbreviations. The source of mutational data of each cohort appear in Rubio-Perez et al. (20015) [10]