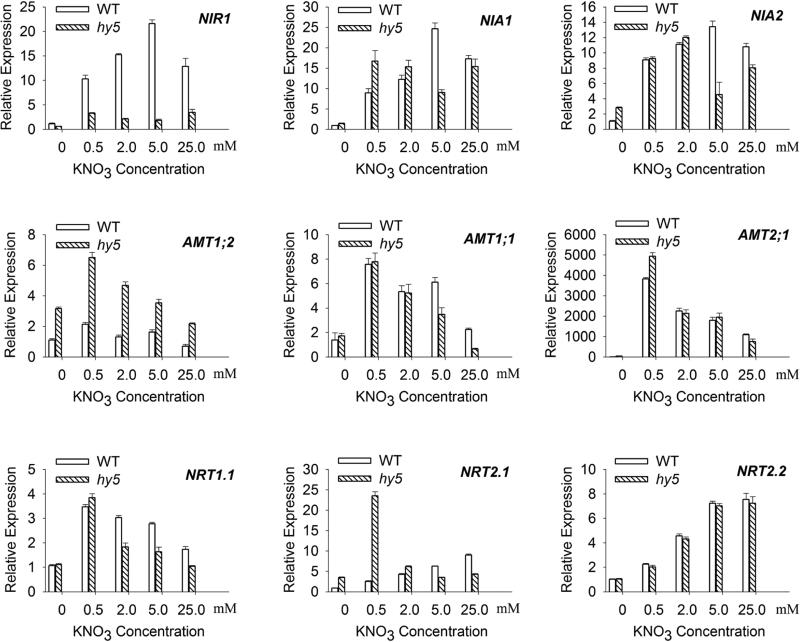
Figure 3.
Effect of the nitrogen supply on RNA expression of genes related to nitrogen metabolism. WT and hy5 mutant seedlings were grown for 10 days on plates with indicated concentration of potassium nitrate. The RNA samples were analyzed by real time RT-PCR against UBQ1 (At3g52590) on following genes: NIR1; NIA1; NIA2; AMT1;2; AMT1;1; AMT2;1; NRT1.1; NRT2.1; NRT2.2. The relative transcript level of WT under 0 mM KNO3 concentration is set to 1. Data presented are means of three repeats, and error bars are standard deviation.

