FIG 3.
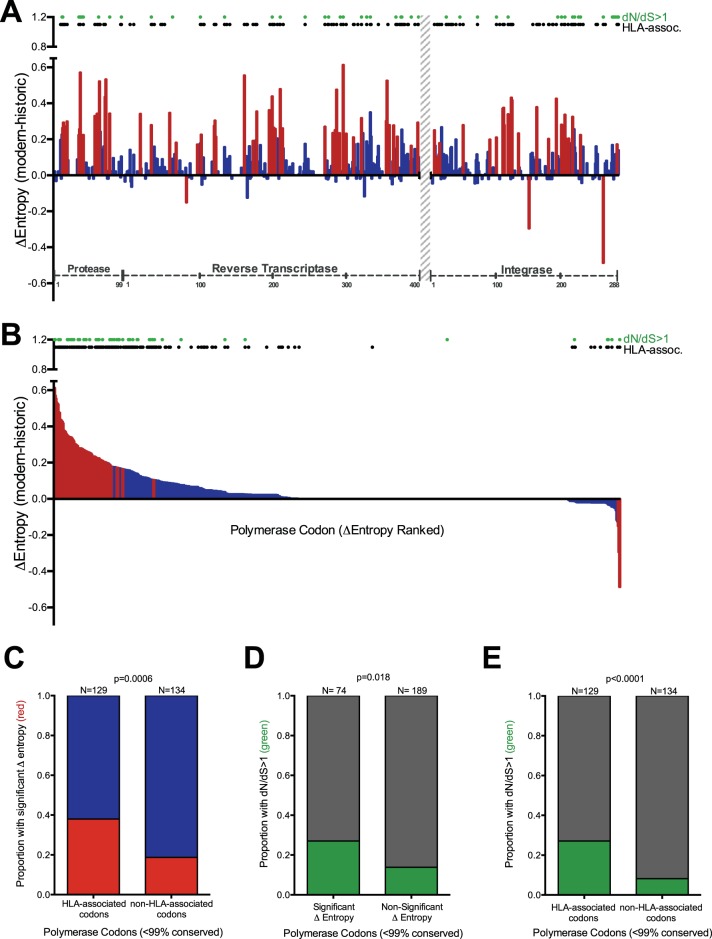
Diversifying polymerase codons are enriched for HLA-associated sites. (A) Per-codon Δentropy values calculated from historic and modern polymerase sequence alignments. HIV protein codon numbering is indicated on the x axis. The region without sequence coverage (RT codons 401 to 560) is indicated with a gray hatched bar. The red and blue bars denote significant (P < 0.001) and nonsignificant Δentropy values, respectively. The black dots denote polymerase codons known to be under HLA-mediated selection (comprehensive definition, q < 0.2 [8]). The green dots denote codons with dN/dS ratios of >1. (B) Same as panel A, but with Δentropy values ranked in descending order rather than by codon. (C) Proportions of HLA-associated and non-HLA-associated polymerase codons exhibiting significant (red) versus nonsignificant (blue) intercohort Δentropy. (D) Proportions of polymerase codons with and without significant intercohort Δentropy exhibiting dN/dS ratios of >1 (green) versus not (gray). (E) Proportions of HLA-associated and non-HLA-associated codons with dN/dS ratios of >1 (green) versus not (gray). Only variable (<99% conserved) polymerase codons were included in the analyses for panels C, D, and E. P values were determined using Fisher's exact test.

