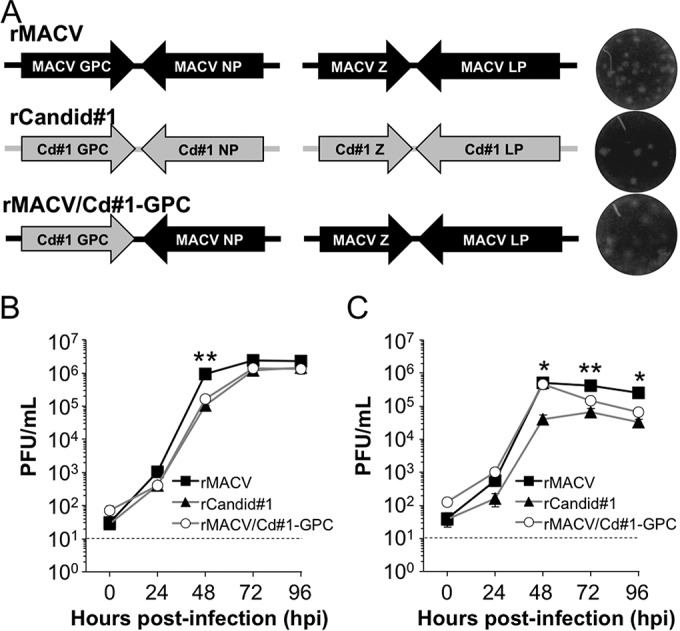
FIG 1.

Schematic representation of the genome of rMACV/Cd#1-GPC and the virus growth curves. (A) For rMACV/Cd#1-GPC, the entire MACV GPC gene was replaced with the Cd#1 GPC gene. The plaque morphology is shown. (B) The growth of rMACV/Cd#1-GPC was characterized in Vero cells (MOI = 0.01). The titer of rMACV was significantly higher than that of rCd#1 at 48 hpi (n = 5; **, P < 0.01, based on one-way ANOVA with Dunnett's posttest comparing the groups to the Cd#1-infected group). The data shown are the averages ± SEMs from three experiments. (C) The growth of rMACV/Cd#1-GPC was characterized in A549 cells (MOI = 0.01). The titer of rMACV was significantly higher than that of rCd#1 at 48 hpi, 72 hpi, and 96 hpi, as well as the titer of rMACV/Cd#1-GPC at 48 hpi (n = 4; *, P < 0.05, based on one-way ANOVA with Dunnett's posttest comparing the groups to the Cd#1-infected group; **, P < 0.01, based on one-way ANOVA with Dunnett's posttest comparing the groups to the Cd#1-infected group). The data shown are the averages ± SEMs from two experiments. Dashed lines, the detection limit.
