FIG 2.
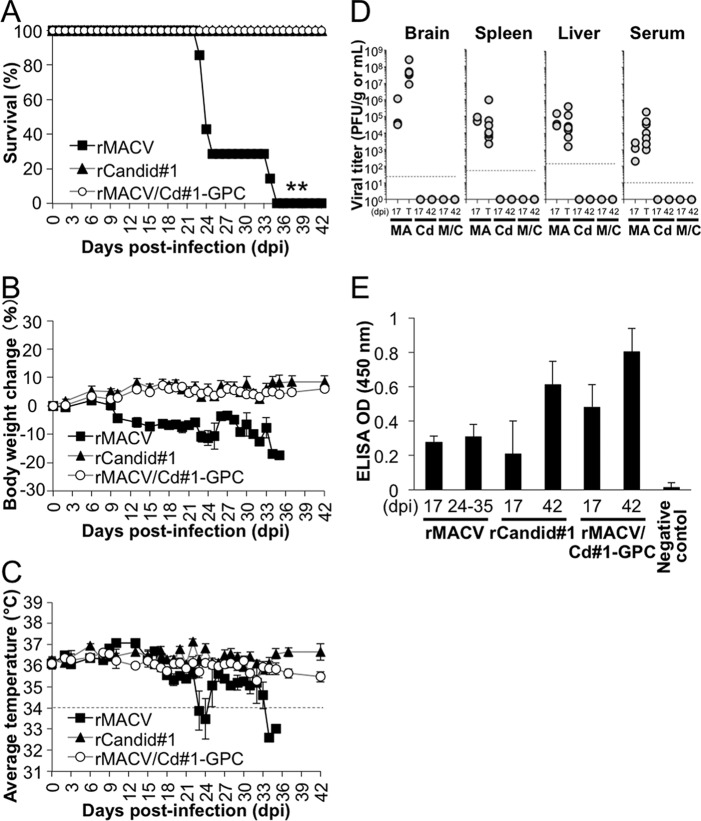
IFN-αβ/γ R−/− mice were infected with 10,000 PFU of rMACV/Cd#1-GPC, rMACV, or rCd#1 by the intraperitoneal route. (A) Survival curves of the infected mice (n = 7 for the rMACV/Cd#1-GPC- and rMACV-infected group; n = 6 for the rCd#1-infected group). **, P < 0.01 for the rMACV-infected group versus the rCd#1-infected group by log rank analysis. (B and C) Body weight (B) and body temperature (C) were monitored on the indicated days. All error bars indicate SEMs (n = 7 for the rMACV/Cd#1-GPC- and rMACV-infected group; n = 6 for the rCd#1-infected group). (D) Titers of rMACV/Cd#1-GPC, rMACV, and rCd#1 in tissues of infected mice at 17 dpi, the terminal stage (T; 24 to 35 dpi), and 42 dpi. The brains, spleens, and livers were harvested and homogenized. Organ tissue and serum samples were subjected to a plaque assay for virus titer. MA, rMACV; Cd, rCd#1; M/C, rMACV/Cd#1-GPC. Dashed line, the minimum detection limit. (E) To detect IgG antibody against the virus, rCd#1-infected cell lysate was used as the capture antigen. The bars show the mean optical density (OD) values plus SDs (n = 3 for 17 dpi, n = 5 for 24 to 42 dpi except for the rCd#1-infected group, for which n = 4). The optical density value obtained from uninfected cell lysates was used as the negative control for cell lysates and was subtracted from the data shown. Sera from 18 uninfected mice were used as the negative control for serum. A cutoff optical density value of 0.146 was defined as the mean +5 SDs for the negative control. All tested samples, except for one sample collected at 17 dpi (from the rCd#1-infected group), were positive. The data shown are pooled from two independent experiments.

