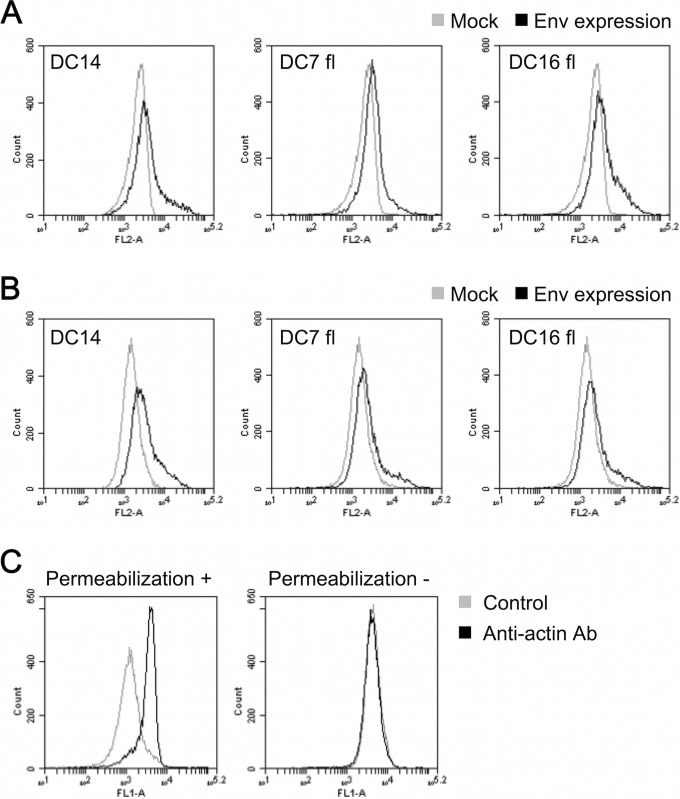
FIG 4.
FACS analysis detection of ERV-DC7 fl and ERV-DC16 fl cell surface expression. (A and B) Detection of Env on the inside and surfaces of cells. HEK293T cells expressing ERV-DC14 Env, ERV-DC7 fl, or ERV-DC16 fl were permeabilized with 90% methanol (A) or left unpermeabilized (B), and the intracellular (A) and cell surface (A and B) Env proteins were stained with goat anti-FeLV SU and PE-conjugated anti-goat IgG antibody. Fluorescent signals were detected by the FL-2 channel of a flow cytometer. Histograms of Env-expressing cells (black) and mock-transfected cells (gray) are overlaid in each graph. The x axis shows signal intensity in FL-2; the y axis shows cell counts. (C) Staining of β-actin in permeabilized (left) or nonpermeabilized (right) samples of mock-transfected cells with mouse anti-β-actin and fluorescein isothiocyanate (FITC)-conjugated goat anti-mouse IgG antibodies. Histograms of the cells treated with anti-β-actin antibody (Ab) and without antibody (control) are overlaid in each graph. The x axis shows signal intensity in FL-1; the y axis shows cell counts.

