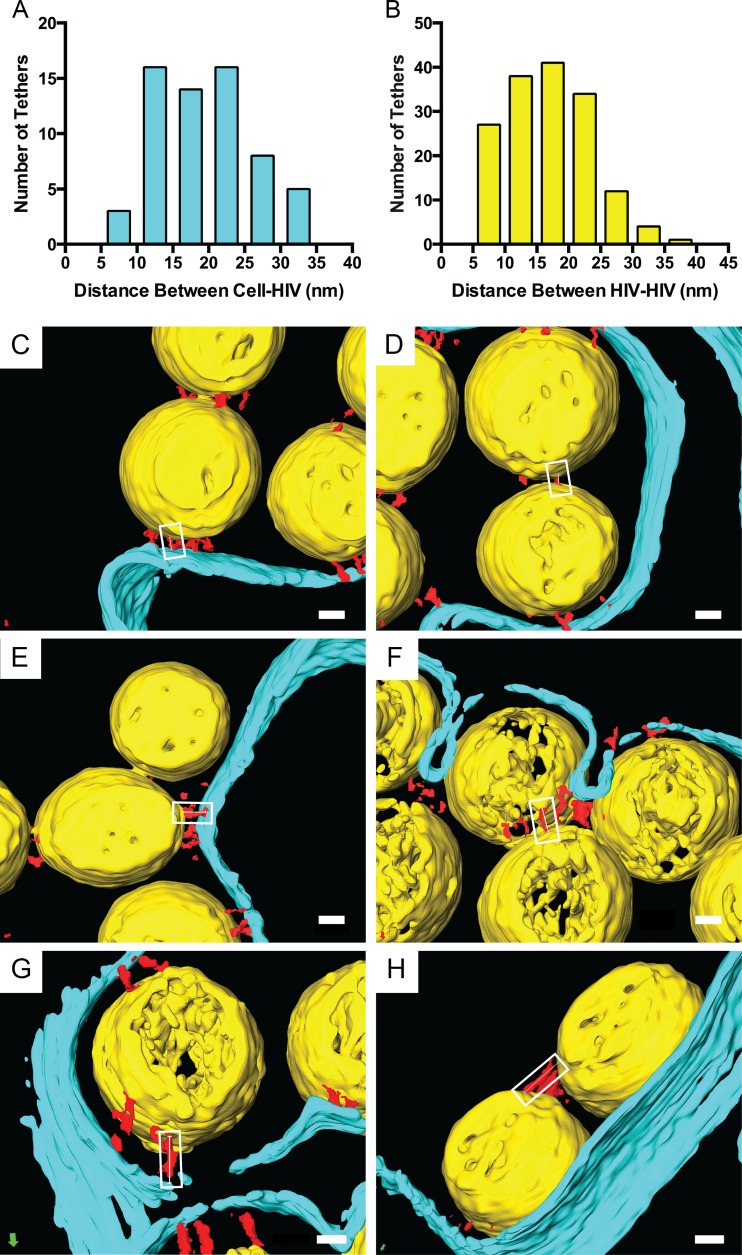
FIG 8.
Distances between tethered HIV-1 virions and the cell. (A and B) Histograms of segmented 3D reconstructions of HIV-1 virions tethered to the cell or other virions. Measurements were made along tethers (red) connecting HIV-1 virions (yellow) to each other or to the plasma membrane (cyan), as indicated by the white boxes and thin white lines. Example images of the following types of HIV-1 tethers are shown: 7.5 to 10 nm (C and D), 17.5 to 20 nm (E and F), and 27.5 to 30 nm (G and H). Values for different classes (means [SD]) were the following: HIV-cell, 19.9 nm (6.88 nm), range of 6.66 to 35.0 nm, n = 62; HIV-HIV, 17.1 nm (6.50 nm), range of 6.82 to 36.6 nm, n = 157. Scale bars are 20 nm.

