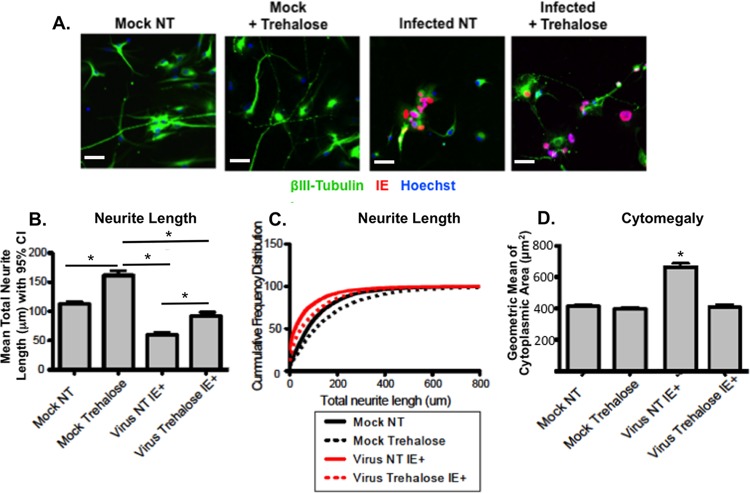
FIG 13.
Trehalose significantly protects against defects in neurite growth and cytomegaly in infected neurons. (A) H9 neurons differentiated for 21 days were harvested and reseeded in 96-well plates. One day after seeding, neurons were mock infected or infected with TB40E at an MOI of 0.1 in the absence (not treated, NT) or presence of 100 mM trehalose. Cells were fixed at 168 hpi and stained with antibodies against βIII-tubulin (green) and HCMV IE (red). Nuclei were counterstained with Hoechst 33342. For each condition, images (five wells and 25 fields for each well) were acquired using the CellInsight high-content microscopy platform. Representative images are shown. Scale bar, 25 μm. (B and C) Quantification of neurite length was performed on approximately 1,000 neurons for each condition using the Cellomics neuronal profiling algorithm. Histograms represent the mean total neurite length per neuron (bar) with 95% confidence intervals for a representative experiment (B). Statistical significance was determined by one-way ANOVA combined with Bonferroni's multiple-comparison test (*, P < 0.001 versus all other conditions). Cumulative frequency distribution (y axis, cumulative percentage of neurons) of total neurite length per neuron (x axis) highlights the defects in neurite length in infected neurons (shorter neurites are observed at the median of the distribution as well as for the highest quartile) (C). Treatment of infected neurons with 100 mm trehalose partially restored neurite length at 50% of the distribution (median) and completely restored neurons with very long neurites (highest quartile). (D) Quantification of cell body area was performed on approximately 1,000 neurons for each condition using the Cellomics neuronal profiling algorithm. Histograms represent the geometric mean of cell body areas (bars) with 95% confidence intervals (error bars). Statistical significance was determined by one-way ANOVA combined with Bonferroni's multiple-comparison test (*, P < 0.001 versus all other conditions). For all panels, each experiment was repeated three times.

